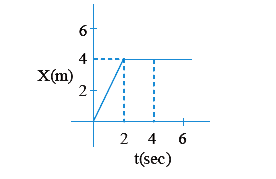
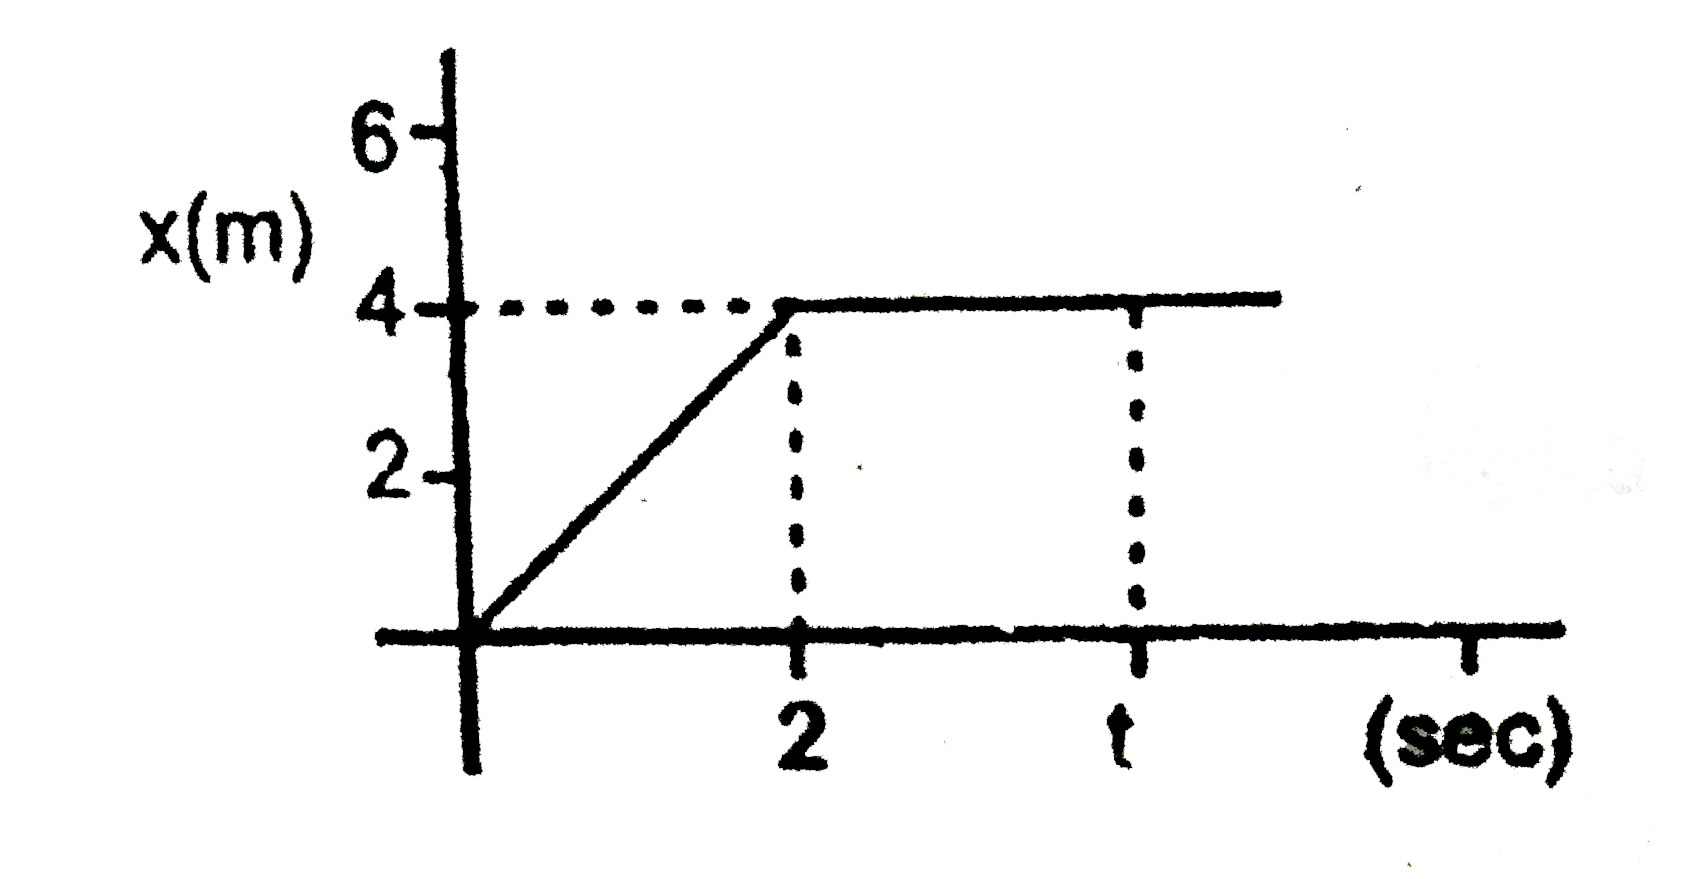
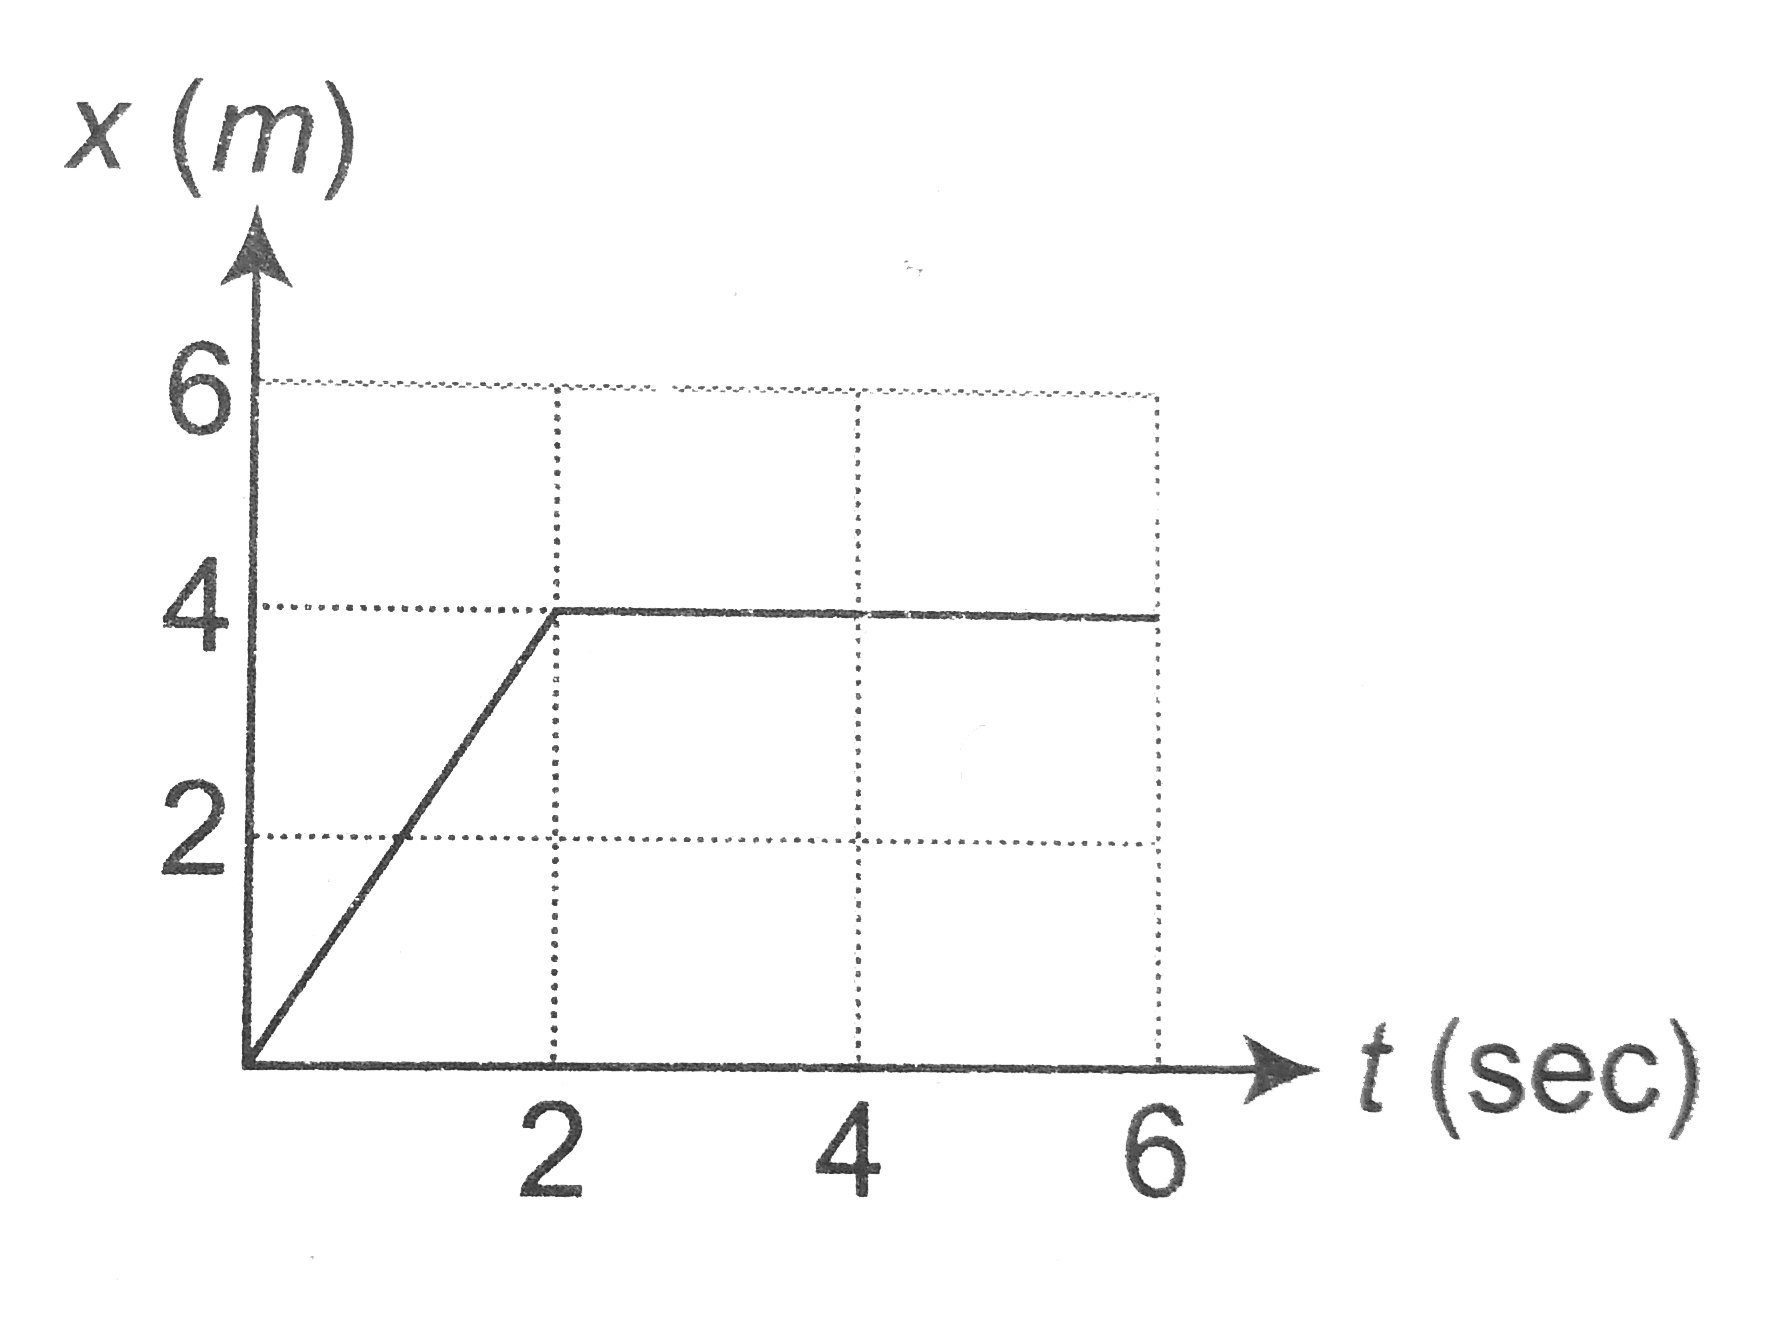
In the figure given, the position-time graph of a particle of mass 0.1 kg is shown. The impulse at t=2 sec is
(##AIIMS_ENT_SP_05_E01_018_Q01.png" width="80%")
v=dxdt=42=2m/s
velocity between t=0 sec to t =2 sec = 2 m/s
velocity at 2 sec = 0 m/s
Impulse = change in linear momentum
=m(Vf−Vi)=0.1(0−2)=−0.2kgms−1
Similar Questions
Knowledge Check
The position time graph of a body of mass 2kg is as given in What is the impulse on the body at t=0 s and t=4s ?
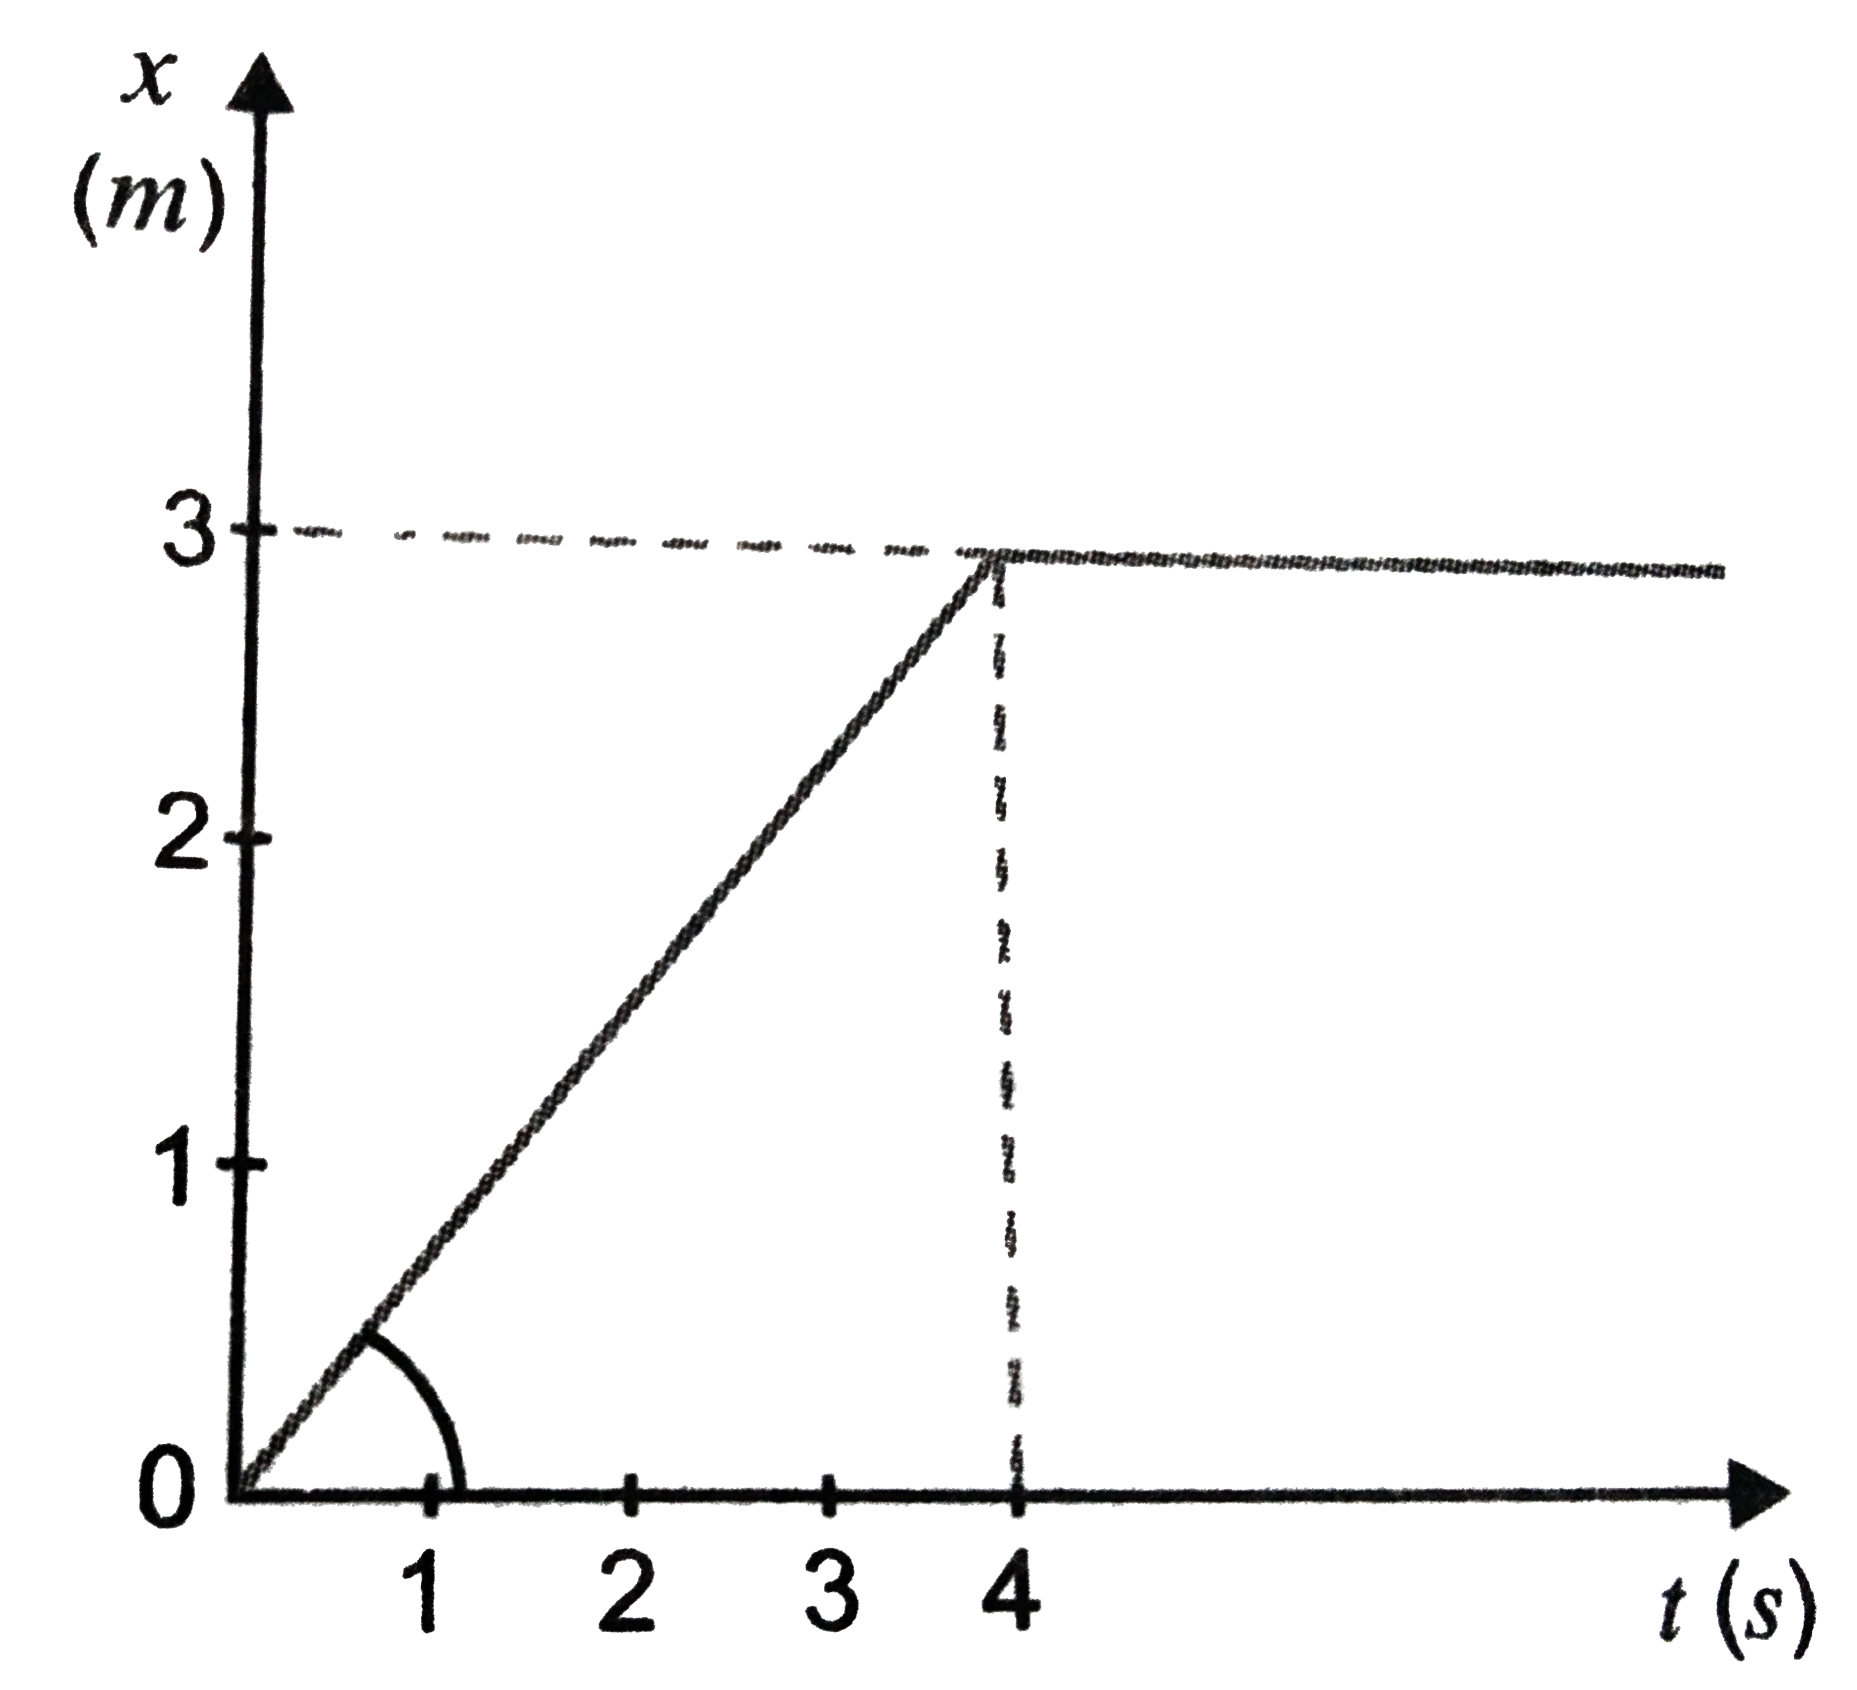 . A23kgms−1B−23kgms−1C32kgms−1D−32kgms−1
The given image represents:
(##OSW_GRU_MCQ_ISC_XII_SM1_BIO_C05_E01_070_Q01.png" width="80%">Achromosomes assorting independently.Bsegregation of incompletely linked genes.Ccrossing over between factors carried on the chromosomes.DBoth (a) and (c)
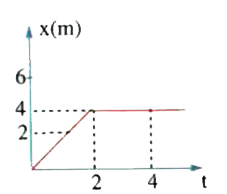
In the figure given below, the position-time graph of a particle of mass 0.1kg is shown. The impuslse at t=2 sec is
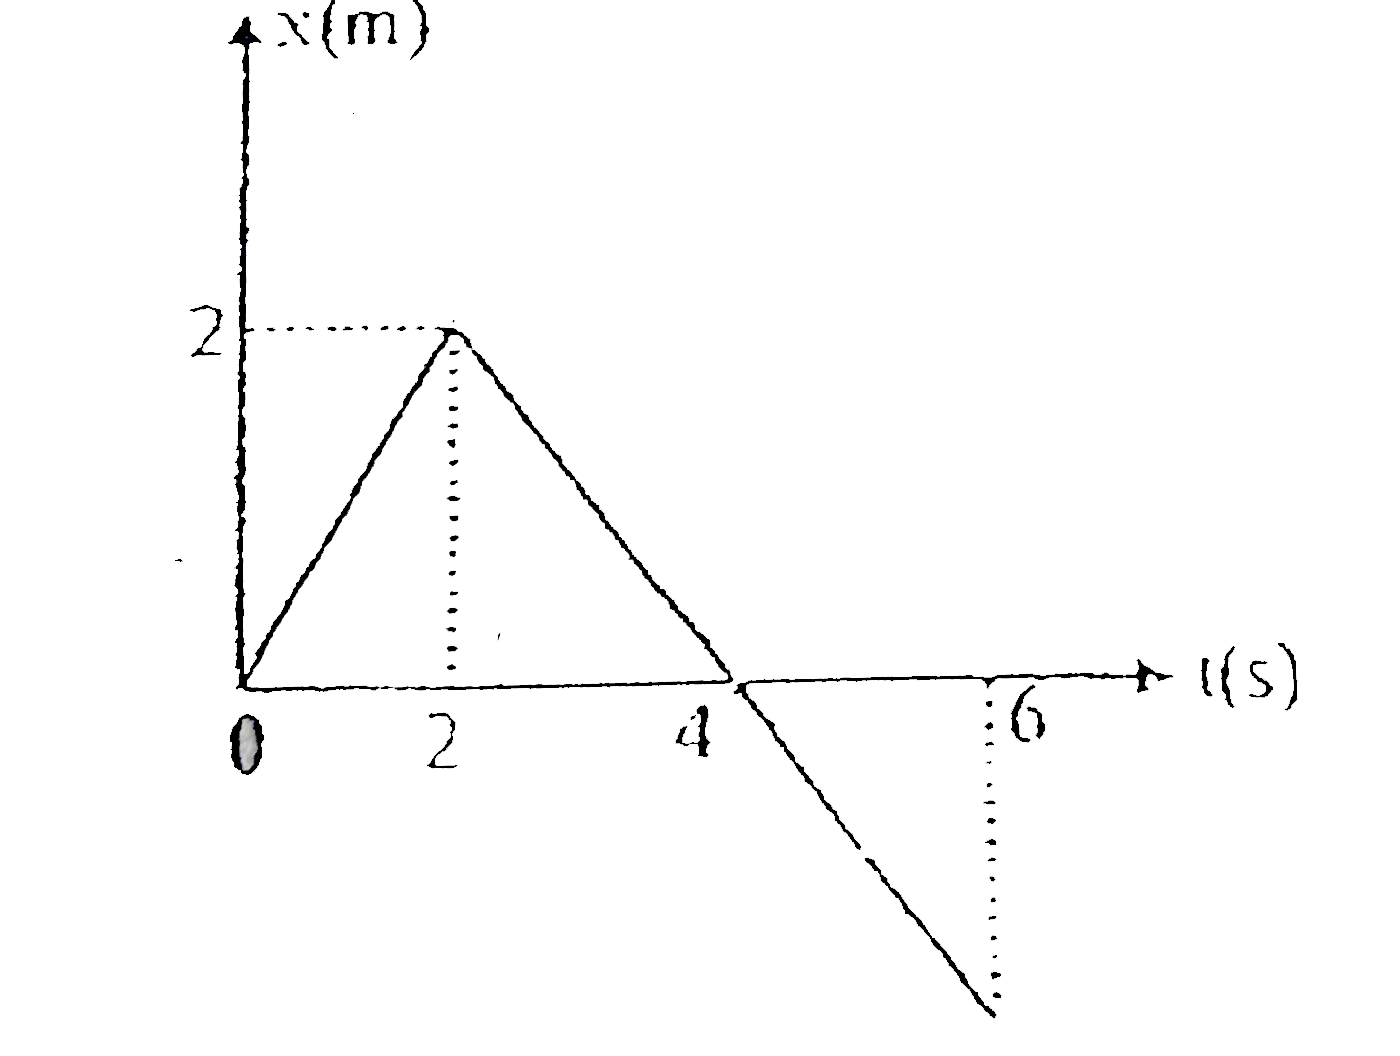
View SolutionPosition time graph of a particle of mass 2 kg is shown in figrure. Total work done on the particle from t=0 to t=4s is
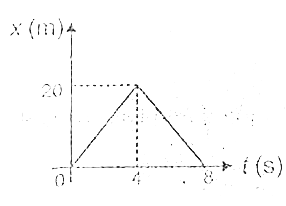
View SolutionThe position (X)-time (t) graph for a particle of mass 1 kg moving along x-axis is shown in figure. Find impulse on particle at t = 4 s.
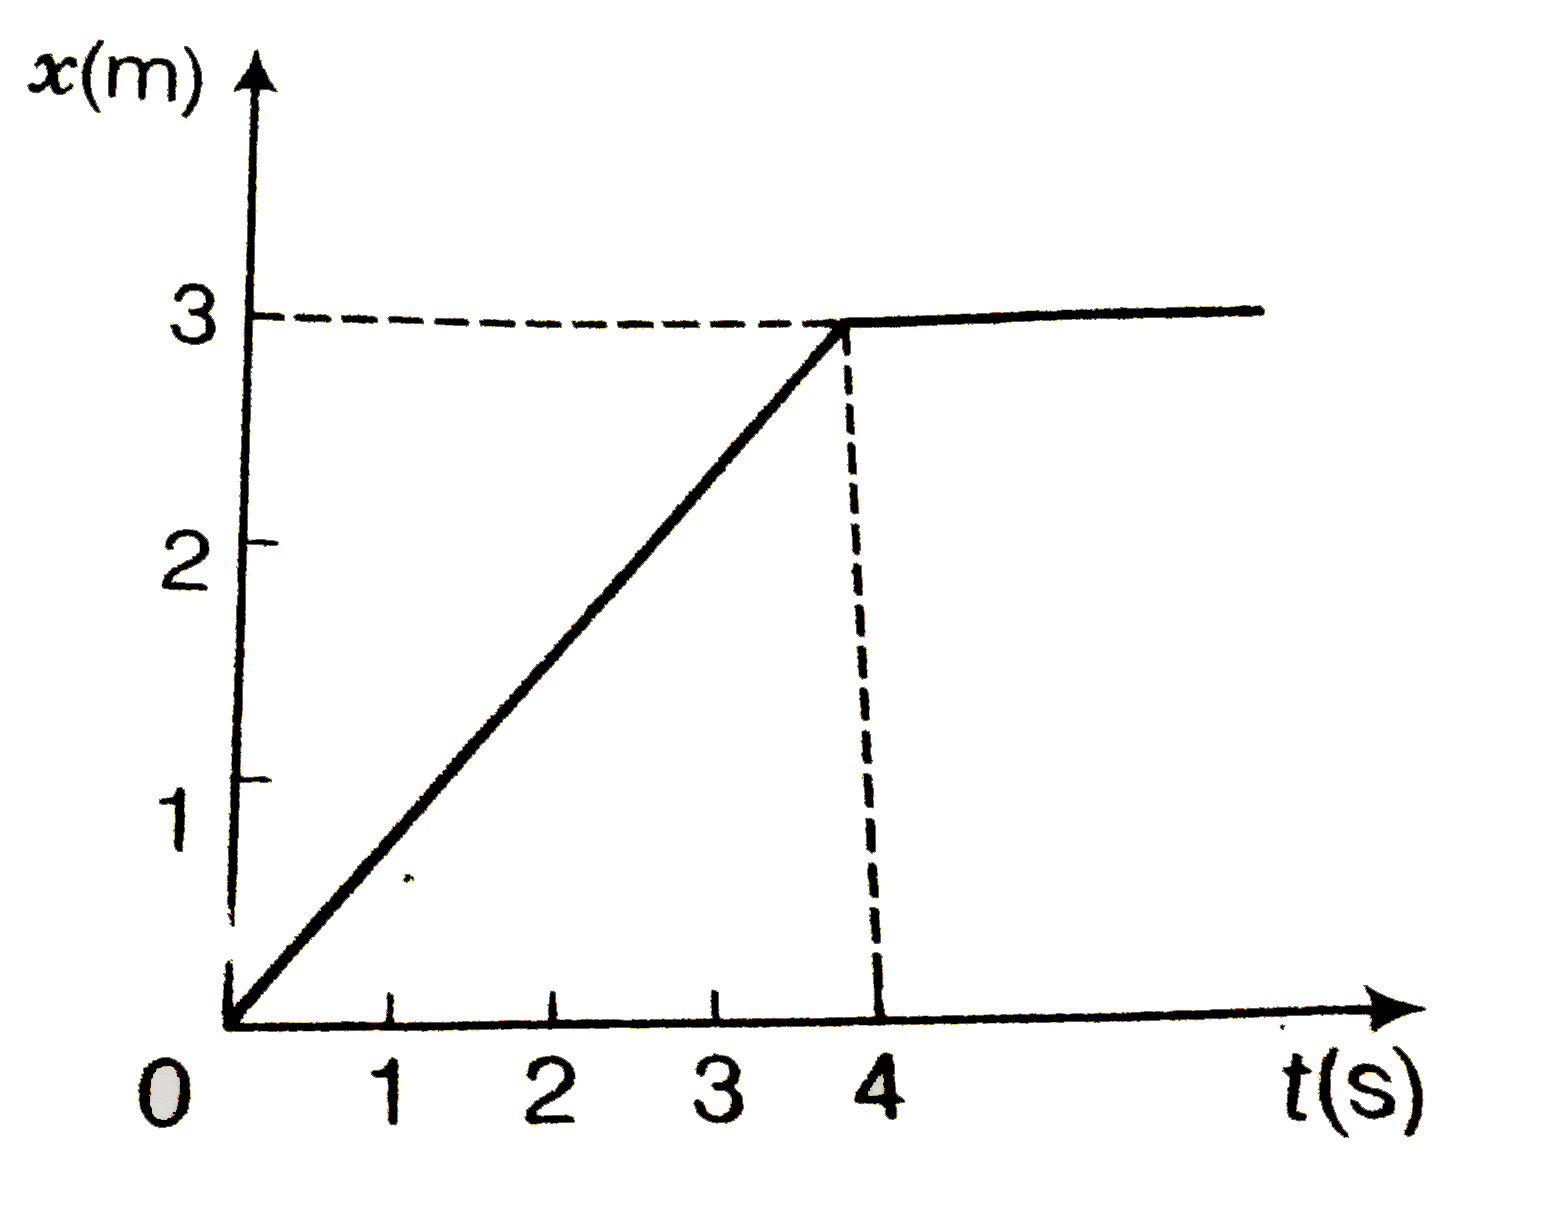
View SolutionThe position-time graph of a body of mass 2 kg is as given in figure . What is the impulse on the body at t = 0 s and t = 4 s .
View SolutionForce-time graph of a particle of mass 6 kg is shown in figure, then change in linear momentum during t = 0 to t = 10 s is
View SolutionMatch the properties and uses of alloys in List 1 with the appropriate answer from List 2.
(##EVRBLKICSECHEX_C07E06054_Q01.png width=80%>
View Solution
