The teacher motivates the student to perform successful experiments a student has collected data on the width of tree trunks and average precipitation rates for different locations the student wants to show the relationship between these two variables what type of graph should the student use?
a multi line graph with the width measurements on the x axis and precipitation rates on the y axis
a scatter plot with the width measurements on the y axis and precipitation rates on the x axis
a bar graph with the width measurements on the y axis and precipitation rates on the x axis
a pie chart with the width of tree shown as a percentage at different precipitation rates
The correct Answer is:D
Step by step video, text & image solution for The teacher motivates the student to perform successful experiments a student has collected data on the width of tree trunks and average precipitation rates for different locations the student wants to show the relationship between these two variables what type of graph should the student use? by Cdp experts to help you in doubts & scoring excellent marks in Class 14 exams.
Updated on:21/07/2023Topper's Solved these Questions
Similar Questions
The table given below shows the number of students who were absent and percentage of students who were present in the given two examinations from five different schools. The table also shows the percentage of students who were present in the Biology and Physics examination respectively.

What is the average of the number of the students who were of the students who were present in Physics examination from schools N. K and L?
View SolutionThe table given below shows the number of students who were absent and percentage of students who were present in the given two examinations from five different schools. The table also shows the percentage of students who were present in the Biology. And Physics examination respectively.
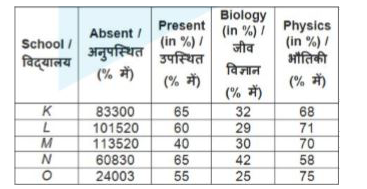 What is the average of the number of the students who were present in Physics examination from school N, K and L?
View Solution
Knowledge Check
In today's world where teachers have a busy schedule, it is noticed that only a few teachers have time for the student's learning experiences. One thing which is lacking in almost all classrooms is teachers motivating students to do better. What happens is that teachers would like to give attention to the students who have high intelligence and who are academically good. A larger portion of the student population is neglected. Teachers blame them for not trying to do their best.
In the passage 7, according to the author, why are teachers not in a position to perform their expected role?AMajority of the students neglect classroom teaching.BThe students are very busy and have less time to learn.CIntelligent students are after the teacher, seeking their help in studiesDNone of theseSarita, an English teacher, observed that her students show differences in learning what she teaches. So Sarita should
Afollow a uniform way of teaching so that individual differences in learning are reducedBmake very strict rules for the students to followCIncorporate a variety of experiences in her teaching to improve learningDnot worry about these differencesUse the following information to answer question.
A student is conducting an experiment using a ball that is attached to the end of a string on a pendulum. The student pulls the ball back so that it is at an angle to its resting position. As the student releases the ball, it swings forward and backward. The student measures the time it takes the ball to make one complete period. A period is defined as the time it takes the ball to swing forward and back again to its starting position. This is repeated using different string lengths.
You must make the student locate an appropriate control variable for this experiment? It is theAThe periodBThe length of the stringCThe mass of the ballDThe color of the ball
The table given below shows the number of students who were absent and percentage of students who were present in the given two examinations from five different schools. The table also shows the percentage of students who were present in the Biology and Physics examination respectively.

What is the difference between the number of students who were present in Physics and that in Biology examination from school N?
View SolutionConsider a box with three terminals on top of it as shown in figure.
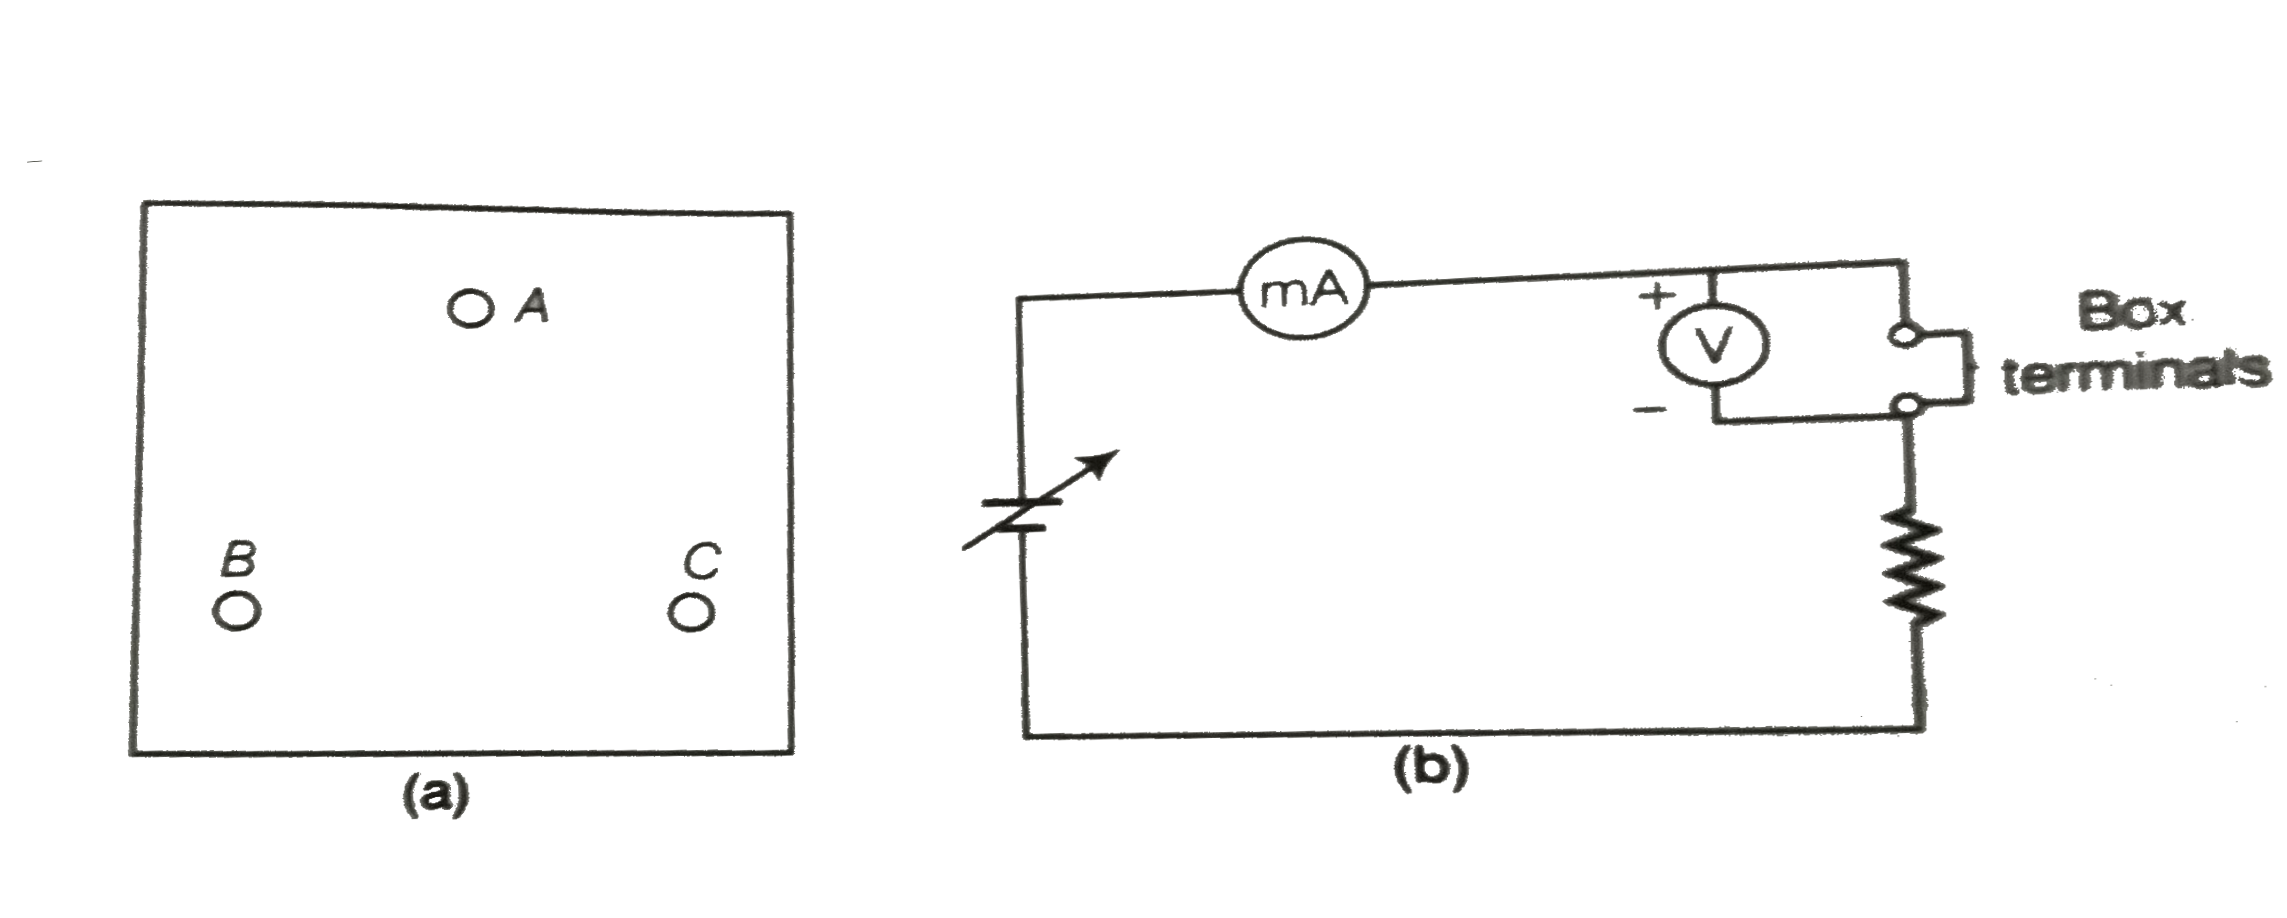
Three components namely, two germanium diodes and one resistor are connected across these three terminals in some arrangement
A student performs an experiment in which any two of these three terminals are connected in the circuit shown in figure.
The student obtains graphs of current-voltage characteristics for unknown combination of components between the two terminals connected in the circuit. The graphs are
(i) When A is positive and B is negative
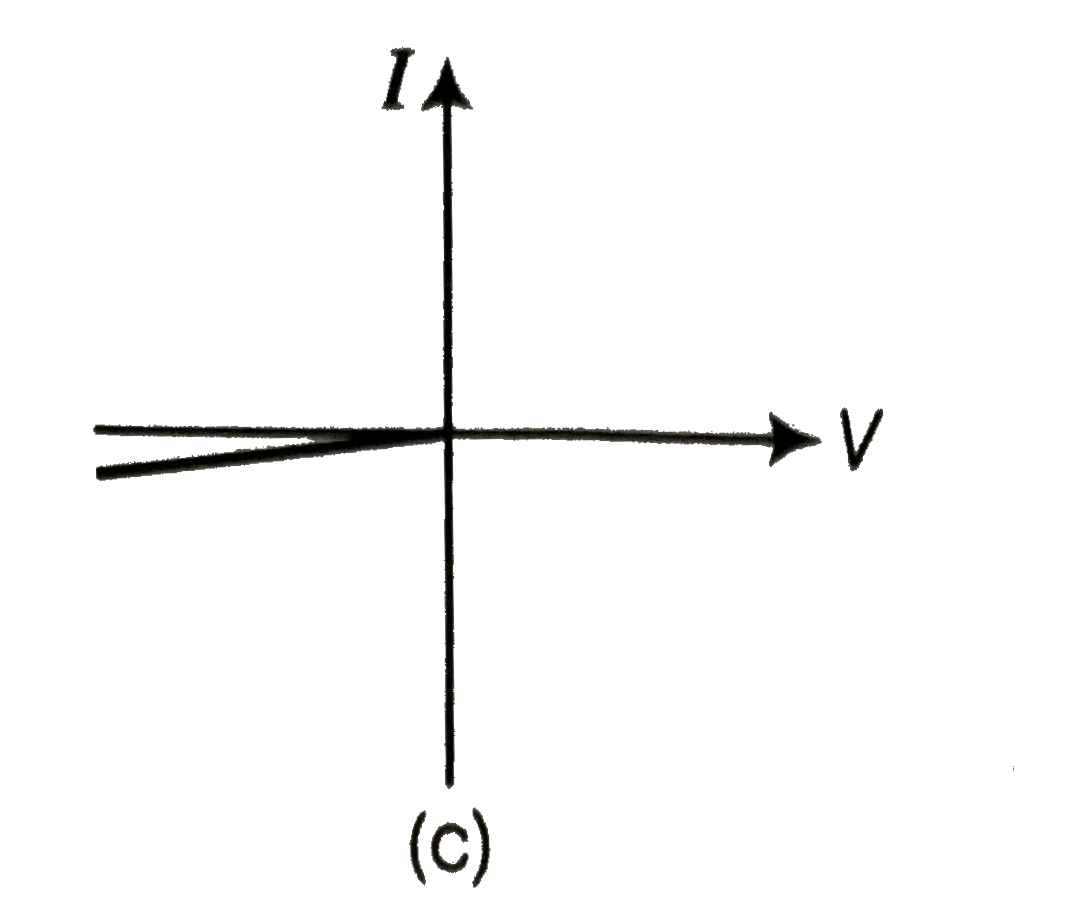
(ii) When A is negative and B is positive
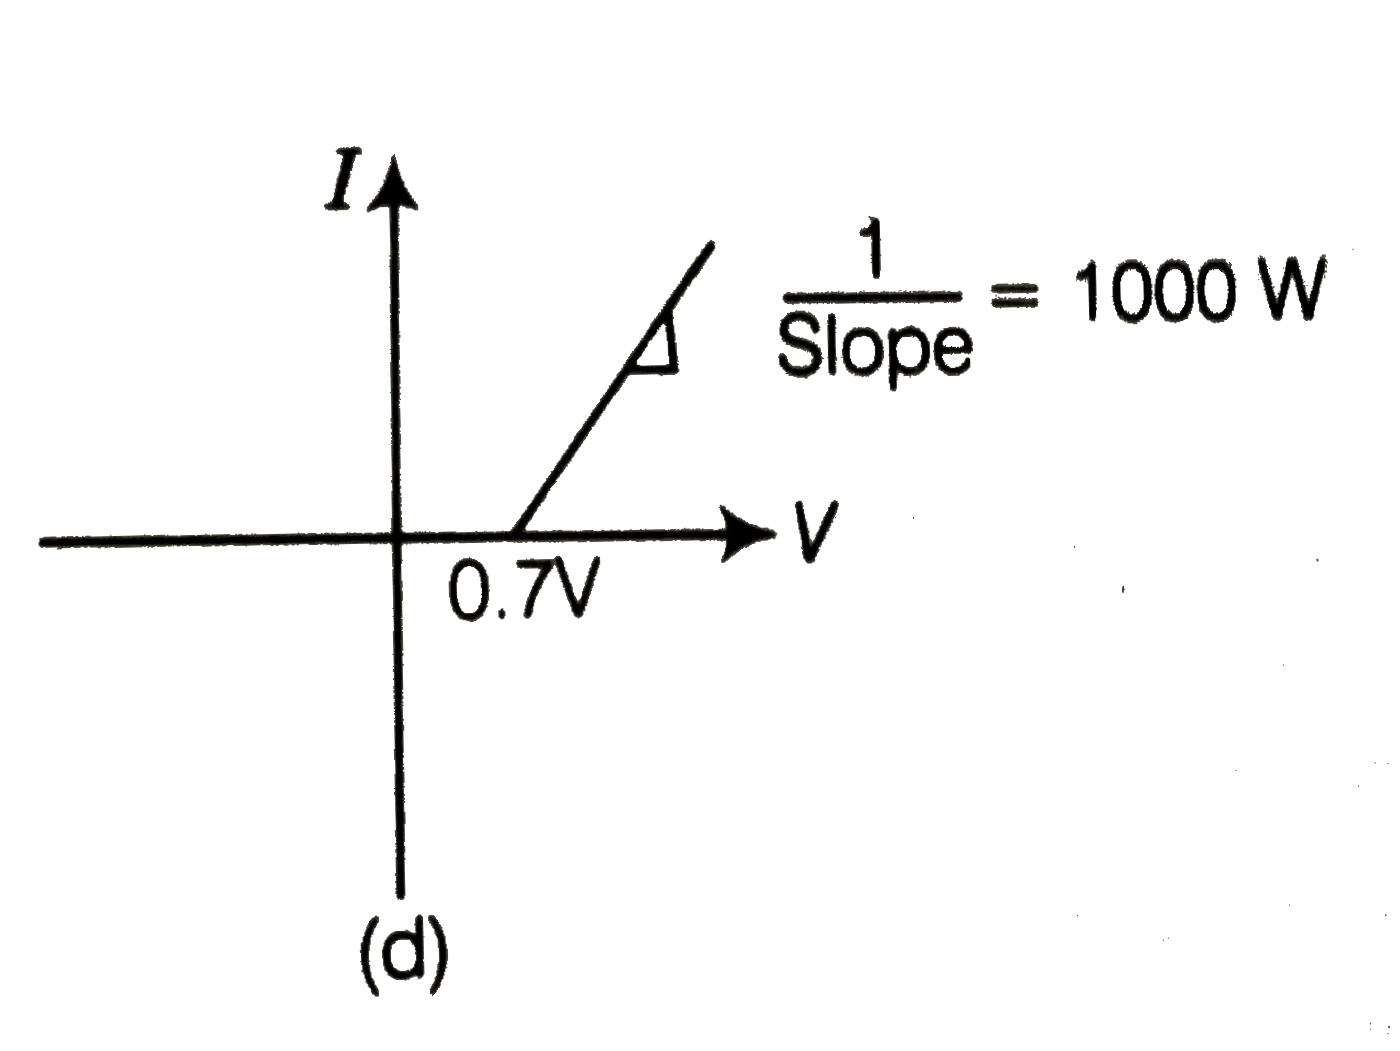
(iii) When B is negative and C is positve
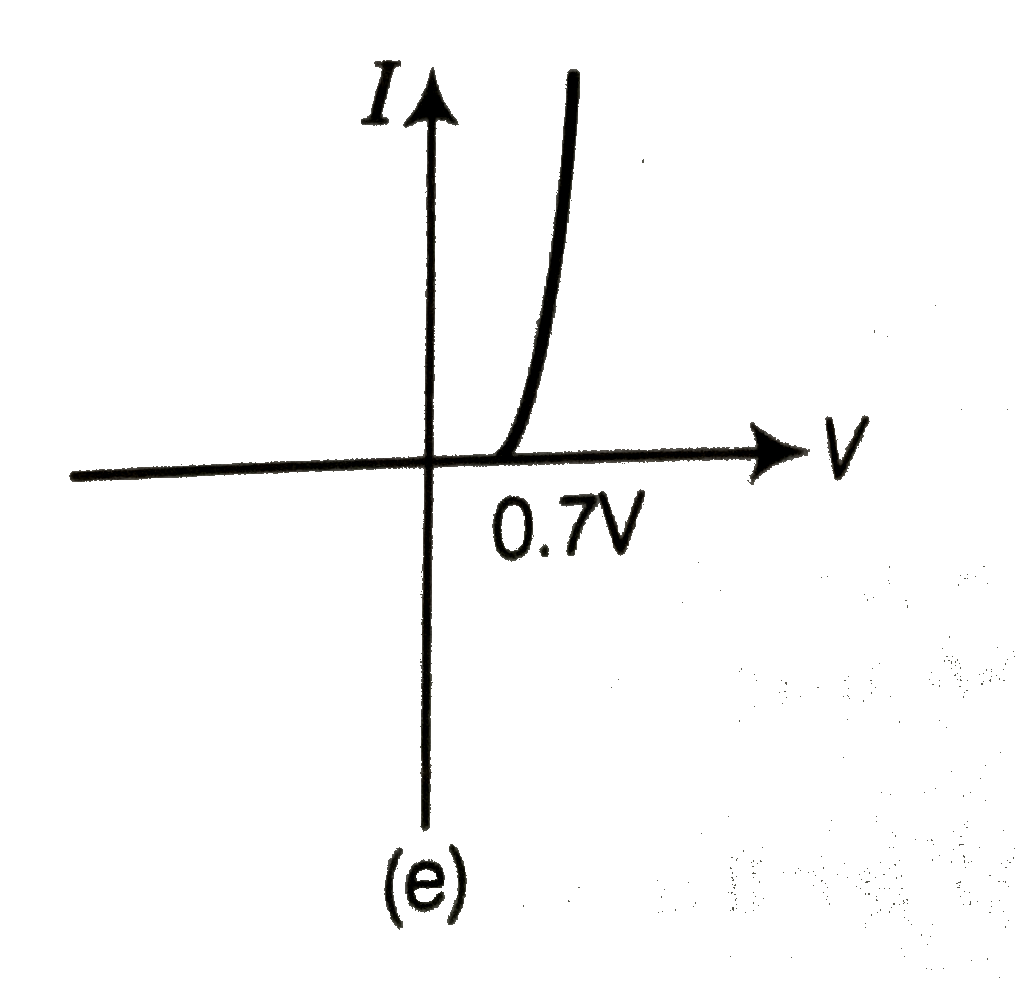
(iv) When B is positive and C is neagtive
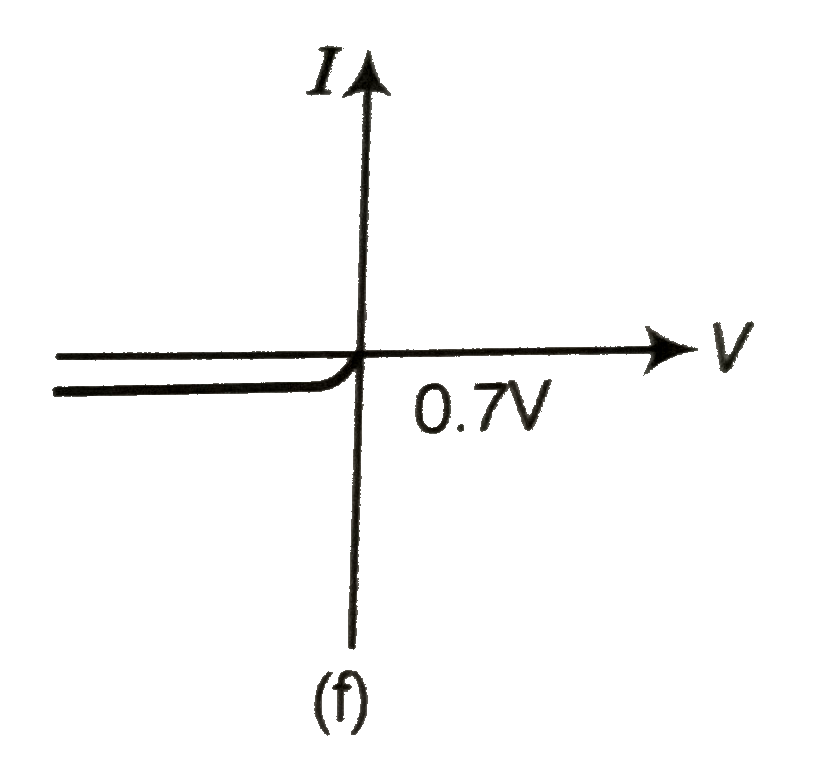
(v) When A is positive and C is negative
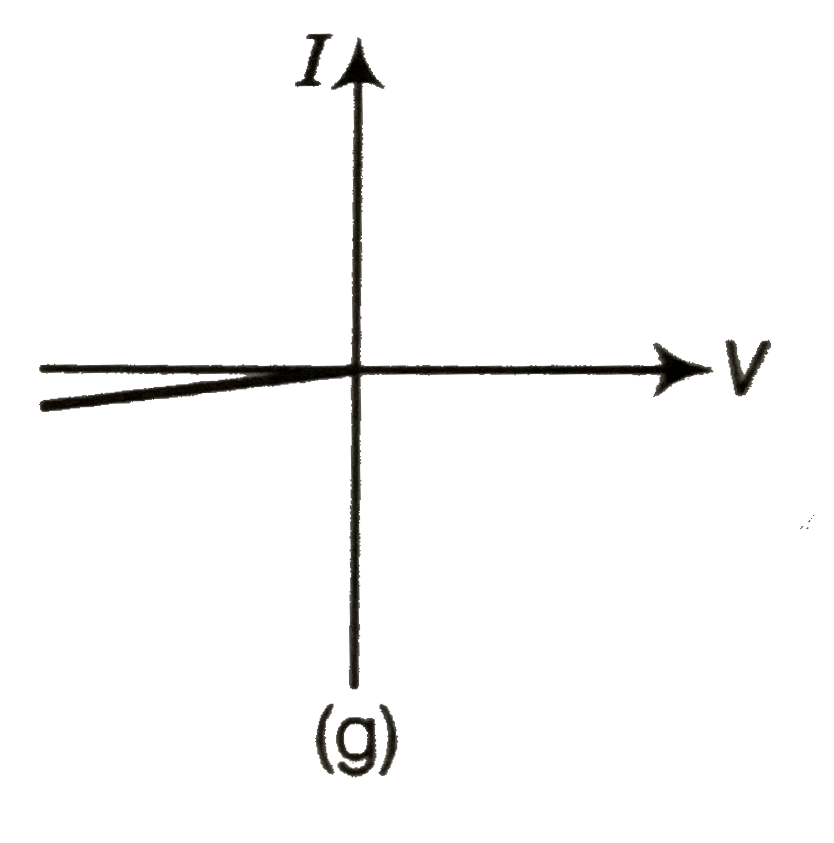
(vi) When A is negative and C is positive
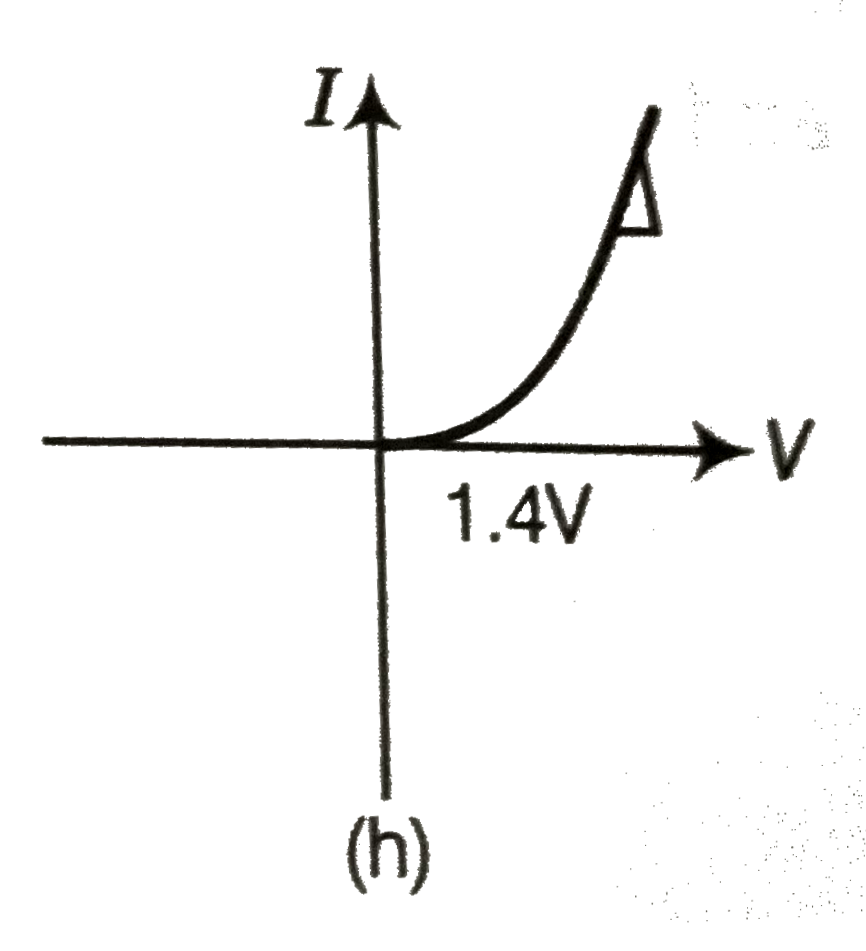
From these graphs of current − voltage characteristic shown in fig. (c) to (h) determine the arrangement of components between A, B and C.
View SolutionA teacher asked the students to write 35×62, but they wrote 3562. what is the numerical difference between the two ?
View SolutionThe line graph shows the number of students of a certain university who passed in the given year in their final exams. Study the diagram and answer the following questions.
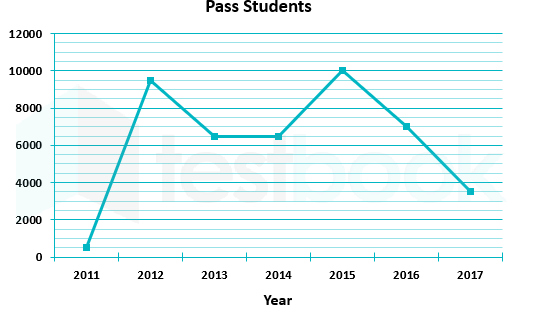
What was the difference in the number of students who passed between the years 2013 and 2016?
View SolutionA teacher has taught measurement of area to class VIII children, but many of her students are confused between the usage of different units of area and volume. What could be the reason for such a confusion in children?
View Solution