Read the following graph and answer the question given below
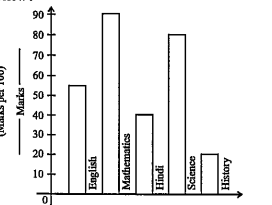
At what subject is the student sharp?
English
Mathematics
Science
History
The correct Answer is:B
Step by step video, text & image solution for Read the following graph and answer the question given below At what subject is the student sharp? by Maths experts to help you in doubts & scoring excellent marks in Class 14 exams.
Similar Questions
Read the following graph carefully and answer the questions given below:
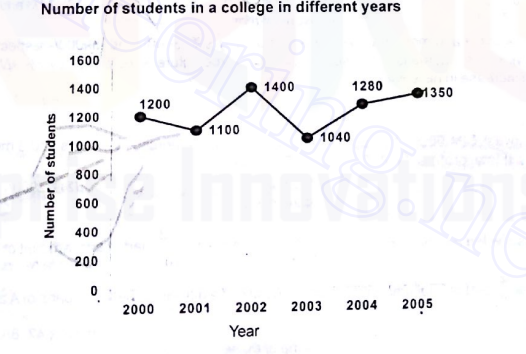
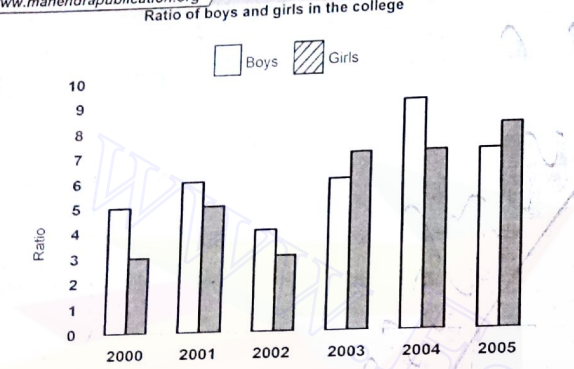
What is the respective ratio of number of boys in the year 2003 and that of girls in the year 2005 ?View SolutionRead the following graph carefully and answer the questions given below:


What is the difference between the number of boys and girls in the year 2004 ?View Solution
Knowledge Check
- Question 1 - Select One
Read the following graph and answer the questions given below-:
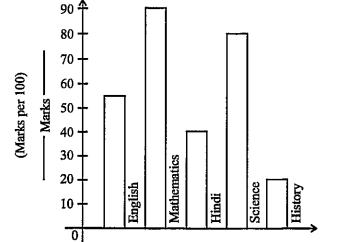
In which subject is the student poor?AenglishBmathematicsCscienceDhistory - Question 2 - Select One
Read the following graph and answer the questions given below
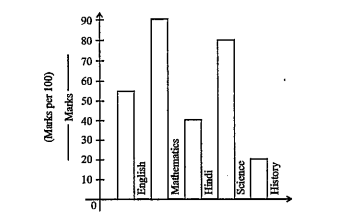
average marks obtained by the student isA57B63C80D48 - Question 3 - Select One
Read the following table carefully and answer the questions given below.

If the number of students appeared from school C in each year is 4800, what is the average number of passed students from school C in all the years ?A2608B2618C2816D2728
Read the following graph carefully and answer the questions given below:


What is the average number of girls in all the years?View SolutionRead the following graph carefully and answer the questions given below:


In which two years the number of girls is equal ?View SolutionStudy the following graph and answer the questions given below it.
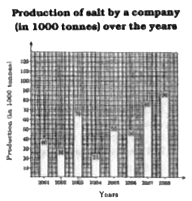
What was the percentage decline in the product of salt from 2003 to 2004 ?View SolutionStudy the following graph and answer the questions given below it.
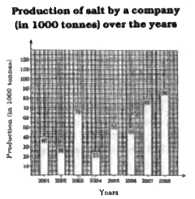
What was the percentage increase in production of salt in 2008 compared to that of 2001 ?View SolutionStudy the following graph and answer the questions given below :
No. of students (in thousands) who opted for three different specializations during the given five years in a University
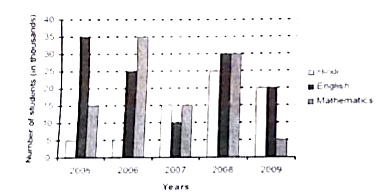
If the total number of students in the University in the year 2007 was 455030, then the total number of students who opted for the given three subjects were approximately what percent of the total students ?View Solution
