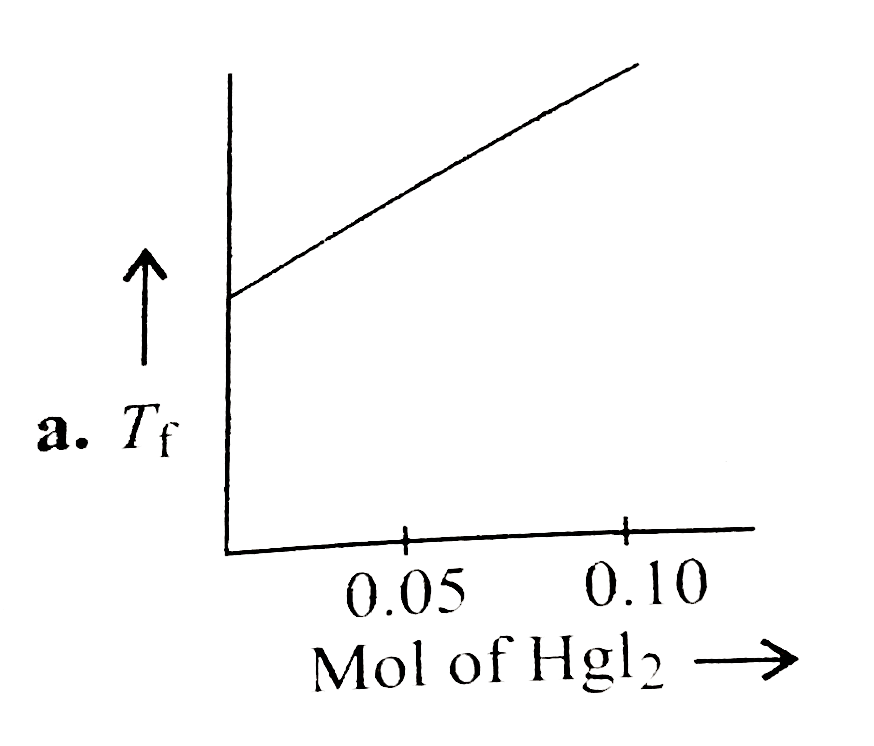
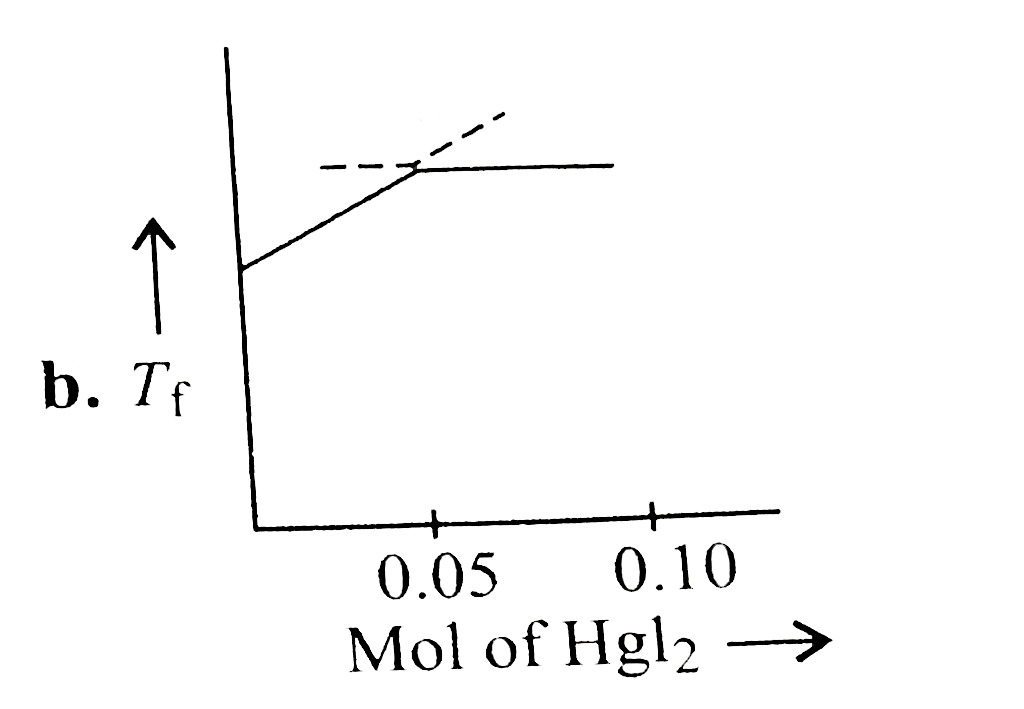
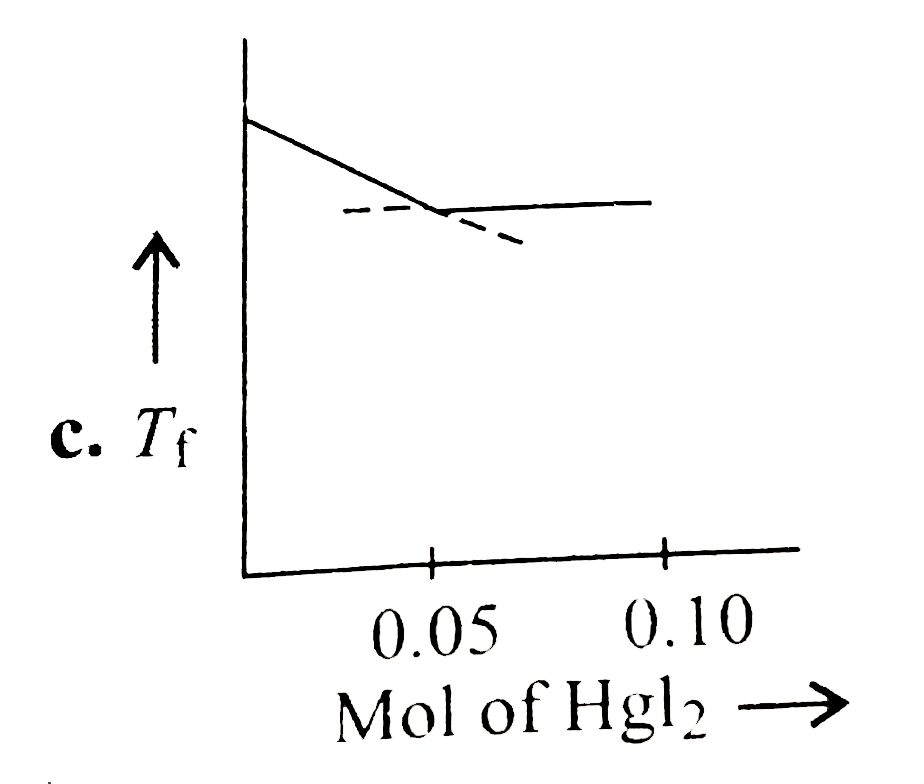
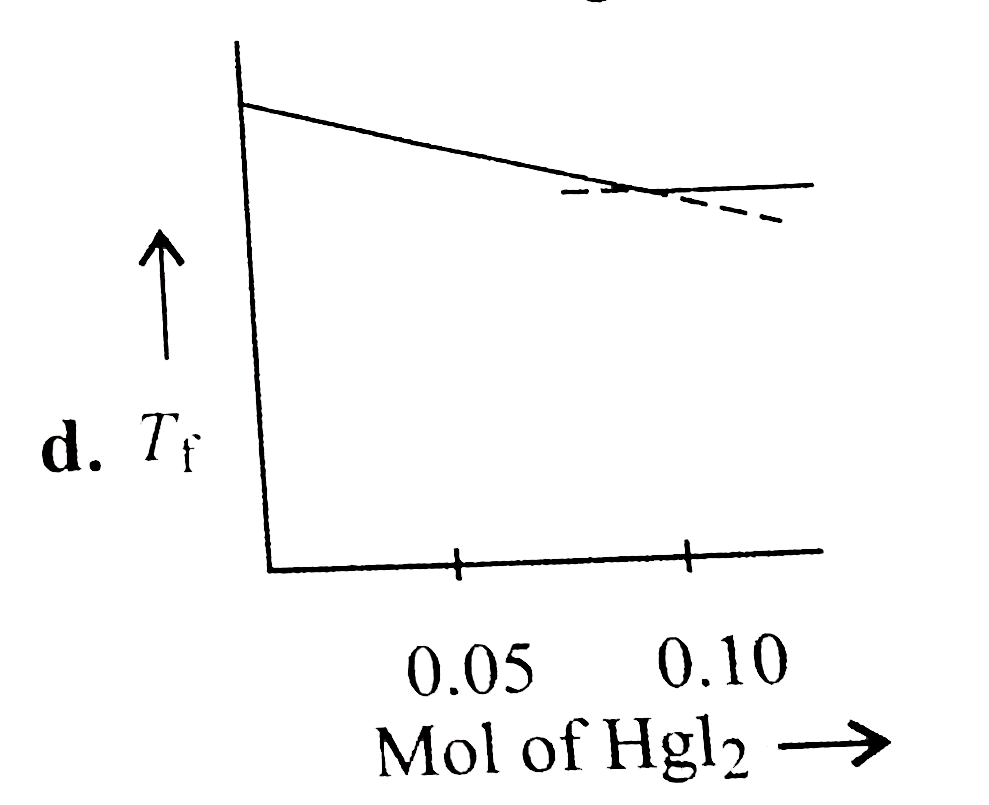
Increasing amount of solid is added to of an aqueous solution containing . Which of the following graphs do represent the variation of freezing point of the resulting with the amount of added?Solution in Kannada


The correct Answer is:B
When is added to KI:
0.05 moles of are required for its complex reaction with KI.
Thus, as is being added, the number of solute molecules will decrease causing to decrease (Causing to increase).When whole of KI has been converted to , further addition of does not change since it is a sparingly soluble salt.
Similar Questions
Adding 1 (m) of KI to the aqueous solution of which of the following will increase the vapor pressure of the solution?
View Solutionजब KI के तनु जलीय विलयन की अधिक मात्रा को सिल्वर नाइट्रेट के तनु जलीय विलयन में मिलाया जाता है, तब हेल्महोट्ज द्विपरत से संगुणित सिल्वर आयोडाइड के कोलॉइडी कण होंगे
View Solutionवक्तव्य I KI (aq) में Hgl2 मिलाने पर विलायक का वाष्प दाब बढ़ जाता है।
वक्तव्य II KI में Hgl2 मिलाने पर प्रभावी कणों की संख्या घट जाती है।
View SolutionOn adding a solute, freezing point of solution _____ .
View SolutionOn adding a solute, freezing point of solution _____ .
View Solution1L जल में निम्न से किसका 0.1 मोल मिलाने पर प्राप्त विलयन का हिमांक न्यूनतम होगा।
View SolutionSTATEMENT-1 : When Hgl_(2) is added to the aqueous solution of Kl, the freezing point is raised. and STATEMENT-2 : Freezing p[oint genarally increases by adding non volatile solute in solvent.
View SolutionTo aqueous solution of Nal increasing amounts of solid HgI_2 is added. The vapor pressure of the solution
View Solution
