To answer the questions, study the graphs below for Subject 1 and 2 showing differentlevels of certain hormones.
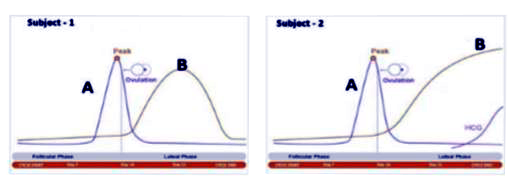
The peak observed in Subject 1 and 2 is due to
Estrogen
Progesterone
Luteinizing hormone
Follicle stimulating hormone
The correct Answer is:C
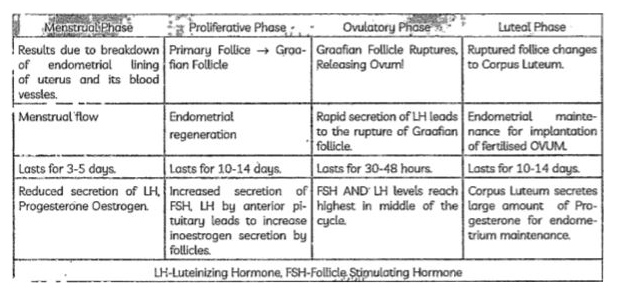
The given diagram explains the peak of luteinising hormone and the events leading to it -
Topper's Solved these Questions
- SAMPLE PAPER 1 BOOK - EDUCART PUBLICATIONCHAPTER - SAMPLE PAPER 1 EXERCISE - SECTION-B
24 Videos
- SAMPLE PAPER (SELF-ASSESSMENT)-11BOOK - EDUCART PUBLICATIONCHAPTER - SAMPLE PAPER (SELF-ASSESSMENT)-11EXERCISE - SECTION -C
1 Videos
- SAMPLE PAPER 10BOOK - EDUCART PUBLICATIONCHAPTER - SAMPLE PAPER 10EXERCISE - SECTION-C
10 Videos
Similar Questions
To answer the questions, study the graphs below for Subject 1 and 2 showing differentlevels of certain hormones.
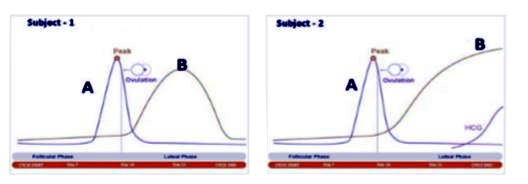
If the peak of Hormone A does not appear in the study for Subject 1, which of thefollowing statement is true?
View SolutionTo answer the questions, study the graphs below for Subject 1 and 2 showing differentlevels of certain hormones.
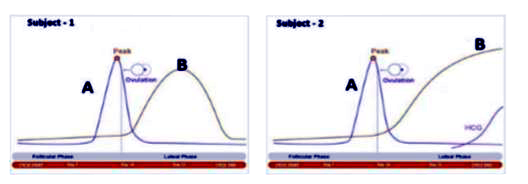
Which of the following statements is true about the subjects?
View Solution
Knowledge Check
Study the graph carefully and answer the questions.
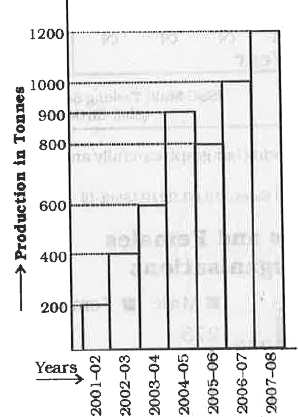
The graph shows production of an item (in tonnes) during certain years
The production from 2003-04 to 2007-08 increased byA125%B50%C75%D100%Study the graph carefully and answer the questions.

The graph shows production of an item (in tonnes) during certain years
The production decreased from 2004-05 to 2005-06 byA1119%B819%C919%D1019
To answer the questions, study the graphs below for Subject 1 and 2 showing differentlevels of certain hormones.
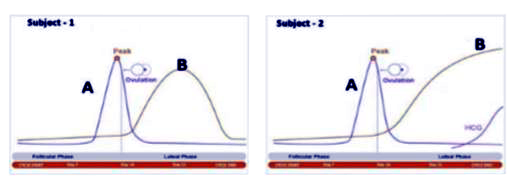
For subject 2 it is observed that the peak for hormone B has reached the plateau stage.After approximately how much time will the curve for hormone B descend?
View SolutionTo answer the questions, study the graphs below for Subject 1 and 2 showing differentlevels of certain hormones.
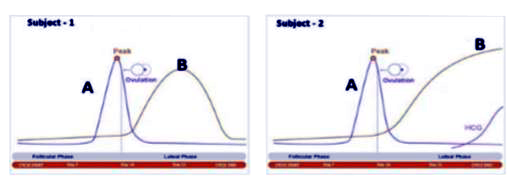
Which structure in the ovary will remain functional in subject 2?
View SolutionTo answer the questions, study the graphs below for Subject 1 and 2 showing differentlevels of certain hormones.
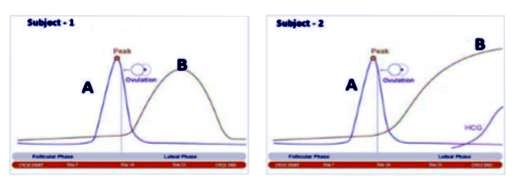
Subject 2 has higher level of hormone B, which is
View SolutionA biology student after studying about the different levels of hormones during the menstrual cycle was comparing 2 subjects (Patients). A table was created after looking at the levels of hormones A and B for Subject 1 and 2. Read the information in the table and answer the questions that follow

The peak observed in Subject 1 and 2 is due to
View SolutionA biology student after studying about the different levels of hormones during the menstrual cycle was comparing 2 subjects (Patients). A table was created after looking at the levels of hormones A and B for Subject 1 and 2. Read the information in the table and answer the questions that follow

The Subject 2 has higher level of hormone B, which is
View SolutionA biology student after studying about the different levels of hormones during the menstrual cycle was comparing 2 subjects (Patients). A table was created after looking at the levels of hormones A and B for Subject 1 and 2. Read the information in the table and answer the questions that follow

For subject 2 it is observed that the peak for hormone B has reached the plateau stage. After approximately how much time will the curve for hormone B descend?
View Solution
