Answer the questions on the basis of the information given below: Coach John sat with the score cards of Indian players from the 3 games in a one-day cricket tournament where the same set of players played for India and all the major batsman got out. John summarized the batting performance through three diagrams, one for each game. In each diagram, the three outer triangles communicate the number of runs scored by the three top scorers from India, where K, R, S,V and Y represent Kaif, Rahul, Saurav, Virender, and Yuvraj respectively. The middle triangle in each diagram denotes the percentage of total score that was scored by the top three Indian scorers in that game. No two players score the same number of runs in the same game. John also calculated two batting indices for each player based on his scores in the tournament, the R-index of a batsman is the difference between his highest and lowest scores in the 3 games while the M-index is the middle number, if his scores are arranged in a non-increasing order.

Which of the players had the best M-index from the tournament?
A
Rahul
B
Saurav
C
Virender
D
Yuvraj
Text Solution
The correct Answer is:B
By analysing the given information :
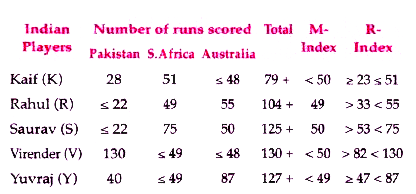

By analysing the above tables, it is clear that Best M-index from the tournament → Saurav (S) (Player)
|
Updated on:21/07/2023
Related Playlists
- BOOK - LUCENT PUBLICATIONCHAPTER - PROBLEM SOLVING (PUZZLES & SEATING ARRANGEMENT)EXERCISE - Exercise-146videos
PROBLEM SOLVING (PUZZLES & SEATING ARRANGEMENT)
- BOOK - LUCENT PUBLICATIONCHAPTER - PROBLEM SOLVING (PUZZLES & SEATING ARRANGEMENT)EXERCISE - Exercise-247videos
PROBLEM SOLVING (PUZZLES & SEATING ARRANGEMENT)
- BOOK - LUCENT PUBLICATIONCHAPTER - PASSAGE AND CONCLUSION EXERCISE - Exercise - 345videos
PASSAGE AND CONCLUSION
- BOOK - LUCENT PUBLICATIONCHAPTER - ROWS AND RANKSEXERCISE - Exercise (Type-IV : Miscellaneous)2videos
ROWS AND RANKS
Similar Practice Problems
- Question 1 - Select One
Answer the questions on the basis of the information given below: Coach John sat with the score cards of Indian players from the 3 games in a one-day cricket tournament where the same set of players played for India and all the major batsman got out. John summarized the batting performance through three diagrams, one for each game. In each diagram, the three outer triangles communicate the number of runs scored by the three top scorers from India, where K, R, S,V and Y represent Kaif, Rahul, Saurav, Virender, and Yuvraj respectively. The middle triangle in each diagram denotes the percentage of total score that was scored by the top three Indian scorers in that game. No two players score the same number of runs in the same game. John also calculated two batting indices for each player based on his scores in the tournament, the R-index of a batsman is the difference between his highest and lowest scores in the 3 games while the M-index is the middle number, if his scores are arranged in a non-increasing order.

How many players among those listed definitely scored less than Yuvraj in the tournament?A0B1C2DMore than 2 - Question 1 - Select One
Answer the questions on the basis of the information given below: Coach John sat with the score cards of Indian players from the 3 games in a one-day cricket tournament where the same set of players played for India and all the major batsman got out. John summarized the batting performance through three diagrams, one for each game. In each diagram, the three outer triangles communicate the number of runs scored by the three top scorers from India, where K, R, S,V and Y represent Kaif, Rahul, Saurav, Virender, and Yuvraj respectively. The middle triangle in each diagram denotes the percentage of total score that was scored by the top three Indian scorers in that game. No two players score the same number of runs in the same game. John also calculated two batting indices for each player based on his scores in the tournament, the R-index of a batsman is the difference between his highest and lowest scores in the 3 games while the M-index is the middle number, if his scores are arranged in a non-increasing order.

Among the players mentioned, who can have the lowest R-index from the tournament ?AOnly Kaif, Rahul or YuvrajBOnly Kaif or RahulCOnly Kaif or YuvrajDOnly Kaif - Question 1 - Select One
Answer the questions on the basis of the information given below: Coach John sat with the score cards of Indian players from the 3 games in a one-day cricket tournament where the same set of players played for India and all the major batsman got out. John summarized the batting performance through three diagrams, one for each game. In each diagram, the three outer triangles communicate the number of runs scored by the three top scorers from India, where K, R, S,V and Y represent Kaif, Rahul, Saurav, Virender, and Yuvraj respectively. The middle triangle in each diagram denotes the percentage of total score that was scored by the top three Indian scorers in that game. No two players score the same number of runs in the same game. John also calculated two batting indices for each player based on his scores in the tournament, the R-index of a batsman is the difference between his highest and lowest scores in the 3 games while the M-index is the middle number, if his scores are arranged in a non-increasing order.

For how many Indian players is it possible to calculate the exact M-index?A0B1C2DMore than 2 - Question 1 - Select One
Answer the questions on the basis of the information given below: Number of players participating in three different games in five different schools.
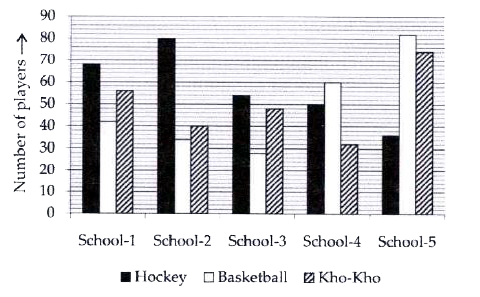
25% of the number of the players participating in hockey from School-5 are females. What is the number of the hockey players who are males in School-5?A15B18C30D27 - Question 1 - Select One
Answer the questions on the basis of the information given below: Number of players participating in three different games in five different schools.
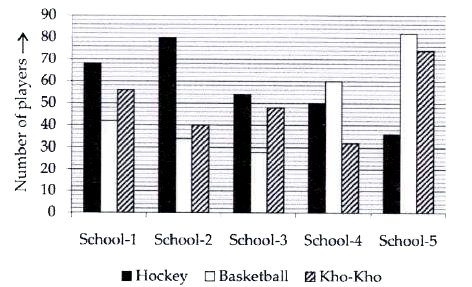
Number of p layers participating in Kho-Kho from School-4 is what percent of number of players participating in hockey from School-2?A42B48C36D40 - Question 1 - Select One
The given histogram represents the frequency distribution of average runs scored by 50 selected players from a district in a local cricket tournament.
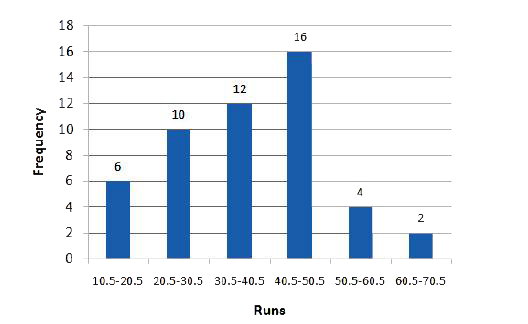
What is the overall average score of the 50 players?A37.1B29.3C32.6D38.5
Similar Questions
66 games were played in a tournament where each player placed one against the rest. The number of players are
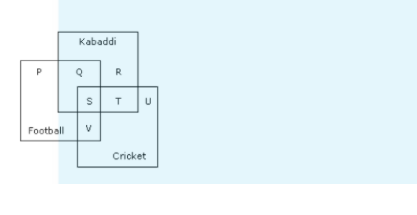
View SolutionIn the following Venn diagram the total number of students who play all the three games is:
 View Solution
The given histogram represents the frequency distribution of average runs scored by 50 selected players from a district in a local cricket tournament
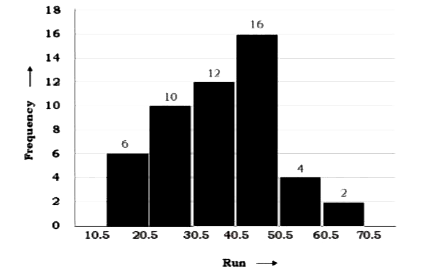
What is the overall average score of the 50 players.View SolutionIf in a chess tournament each contestant plays once against each of the other and in all 45 games are played, then the number of participants, is
View Solution

