Frequency polygon can be drawn after drawing
ogive
bar chart
histogram
None of these
The correct Answer is:C
Step by step video, text & image solution for Frequency polygon can be drawn after drawing by Maths experts to help you in doubts & scoring excellent marks in Class 12 exams.
Topper's Solved these Questions
- BOOK - ARIHANT PUBLICATION BIHARCHAPTER - STATISTICSEXERCISE - EXAM BOOSTER (FOR CRACKING EXAM)25videos
STATISTICS
- BOOK - ARIHANT PUBLICATION BIHARCHAPTER - SIMPLE INTEREST AND COMPOUND INTEREST EXERCISE - Exam Booster for Cracking Exam25videos
SIMPLE INTEREST AND COMPOUND INTEREST
- BOOK - ARIHANT PUBLICATION BIHARCHAPTER - TAXATIONEXERCISE - EXAM BOOSTER FOR CRACKING EXAM14videos
TAXATION
Similar Questions
Knowledge Check
- Question 1 - Select One
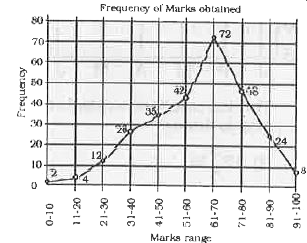
The marks obtained by 273 examinees are shown by the frequency polygon. Given that mean marks is 59.5. Study the frequency polygon and answer the given questions.
Percentage of the students who get above 80% marks isA9.81B10.53C11.28D11.72 - Question 2 - Select One
The marks obtained by 273 examinees are shown by the frequency polygon Given that mean marks is 59.5 Study the frequency polygon and answer the given question

यदि उत्तीर्ण अंक 40 हो तो बताये कितने % छात्र फैल हुए ।A72B105C152D164
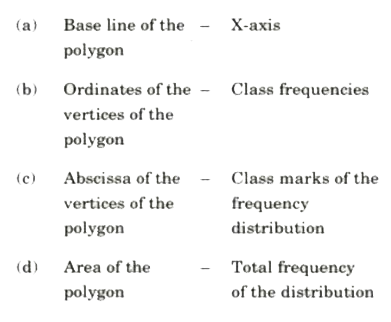
The following pairs relate to frequency distribution of a discrete variable and its frequency polygon. Which one of the following pairs is not correctly matched ?
 View Solution
Draw the frequency polygon representing the following frequency distribution
 View Solution
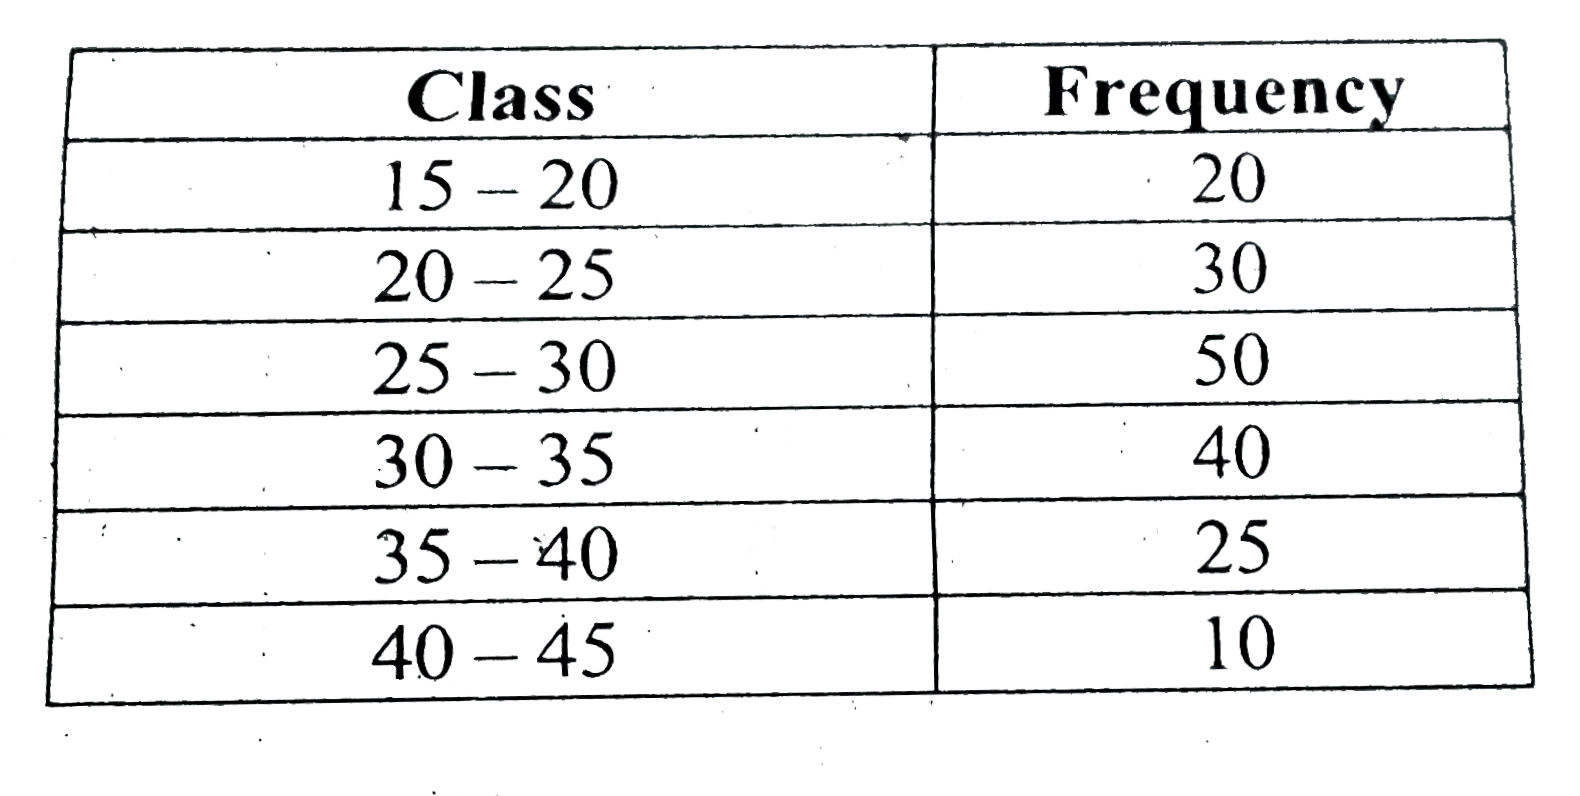
Draw histrogram and frequency polygon on the same graph paper for the following frequency distribution:
 View Solution
Define frequency polygon.
View SolutionConstruct the frequency polygon for the following data:
 View Solution
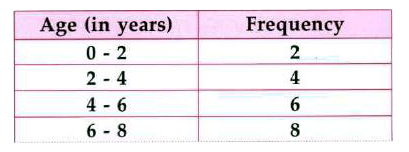
Construct a frequency polygon for the following data.
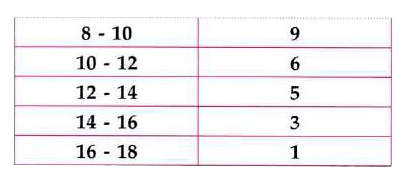 View Solution


