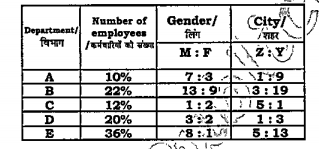
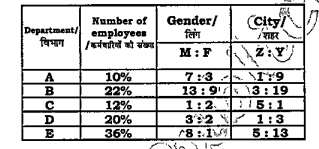
यह तालिका विभिन्न कम्पनियों में काम कर रहे कर्मचारियों की संख्या को और संबंधित कम्पनियो में काम कर रही महिला कर्मचारियों के प्रतिशत को दर्शाता है।
अगर कम्पनी E के कुल कर्मचारी में से 20 % छोड़ देते है , तो कम्पनी E में काम कर रहे पुरुष कर्मचारियों की संख्या की तुलना में कम्पनी C में काम कर रही महिला कर्मचारियों की संख्या का अनुपात क्या है, यह मानते हुए की कुल कर्मचरियो में से 20 % के छोड़ देने के बाद भी पुरुष और महिला का अनुपात समान रहता है ?

7:12
12:17
16:9
9:11
The correct Answer is:C
Step by step video, text & image solution for यह तालिका विभिन्न कम्पनियों में काम कर रहे कर्मचारियों की संख्या को और संबंधित कम्पनियो में काम कर रही महिला कर्मचारियों के प्रतिशत को दर्शाता है। अगर कम्पनी E के कुल कर्मचारी में से 20 % छोड़ देते है , तो कम्पनी E में काम कर रहे पुरुष कर्मचारियों की संख्या की तुलना में कम्पनी C में काम कर रही महिला कर्मचारियों की संख्या का अनुपात क्या है, यह मानते हुए की कुल कर्मचरियो में से 20 % के छोड़ देने के बाद भी पुरुष और महिला का अनुपात समान रहता है ? by Maths experts to help you in doubts & scoring excellent marks in Class 14 exams.
Updated on:21/07/2023Similar Questions
The given table shows the number (in percent) of employees working in different depratments of an organization. The table also shows the ratio of males and females and the ratio of employees living in city Z and employees , living in city Y. The total number of employees in the organization 80,000.
दी गई तालिका में एक संगठन के विभिन्न विभागों में कार्य कर रहे कर्मचारियों की संख्या ( प्रतिशत में ) को दर्शाया गया है। यह तालिका पुरूषों तथा महिलाओं के अनुपाव को तथा शहर ,Z में रह रहे कर्मचारियों तथा शहर Y में रह रहे कर्मचारियों के अनुपात को भी दर्शाती है। संगठन रद में कुल कर्मचारियों की संख्या 80000 है। On an average how many residents of city Y are working in each department?
शहर Y के कितने निवासी औसतन एक विभाग में कार्य कर रहे है?
View SolutionThe given table shows the number (in percent) of employees working in different depratments of an organization. The table also shows the ratio of males and females and the ratio of employees living in city Z and employees , living in city Y. The total number of employees in the organization 80,000.
दी गई तालिका में एक संगठन के विभिन्न विभागों में कार्य कर रहे कर्मचारियों की संख्या ( प्रतिशत में ) को दर्शाया गया है। यह तालिका पुरूषों तथा महिलाओं के अनुपाव को तथा शहर ,Z में रह रहे कर्मचारियों तथा शहर Y में रह रहे कर्मचारियों के अनुपात को भी दर्शाती है। संगठन रद में कुल कर्मचारियों की संख्या 80000 है। what are the total number of employee in department A and E together?
विभाग A तथा E में मिलाकर कुल कर्मचारियों की संख्या क्या है?
View SolutionThe ratio of the number of men and women in a factory is 14: 19. If the total number of employees in the factory is 2145, then the number of women in the factory is:
एक कारखाने में पुरुषों और महिलाओं की संख्या का अनुपात 14:19 है। यदि कारखाने में कर्मचारियों की कुल संख्या 2145 है, तो कारखाने में महिलाओं की संख्या है
View SolutionA can do a piece of work in 6 days. B can do it in 9 days. With the assistance of C they completed the work in 3 days. In how many days can C alone do the work? /
A 6 दिनों में एक काम कर सकता है। B इसे 9 दिनों में कर सकता हैं। C की सहायता से उन्होंने 3 दिनों में काम पूरा कर लिया। तो C अकेले कितने दिनों में यह काम करेगा?
View SolutionThe given Bar Graph presents the number of students of two schools for six years. दिया गया दंड आरेख छः वर्ष की अवधि में दो विद्यालयों में छात्रों की संख्या को दर्शाता है | In which year, the percentage increase in students in school B is the highest in comparison to its previous year? किस वर्ष में, विद्यालय B में छात्रों की संख्या में प्रतिशत वृद्धि इसके पिछले वर्ष की तुलना में सबसे अधिक रही है?
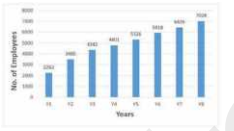
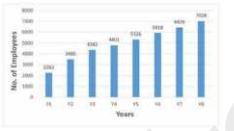
View SolutionThe Bar graph shown below presents the number of employees in an office during eight consecutive years.
नीचे दिया गया दंड आरेख किसी कार्यालय में आठ लगातार वर्षों के दौरान कर्मचारियों की संख्या को दर्शाता है |
What is the growth percentage in the number of employees from Y5 to Y6?
Y5 से Y6 तक कर्मचारियों की संख्या में वृद्धि का प्रतिशत कितना है ?
View SolutionThe Bar graph shown below presents the number of employees in an office during eight consecutive years.
नीचे दिया गया दंड आरेख किसी कार्यालय में आठ लगातार वर्षों के दौरान कर्मचारियों की संख्या को दर्शाता है |
The number of employees in year Y2 is how much percent less than the average number of employees per year?
वर्ष Y2 में कर्मचारियों की संख्या प्रति वर्ष कर्मचारियों की औसत संख्या से कितना प्रतिशत कम है ?
View SolutionThe given pie chart shows the percentage distribution of 450 employees in an organization. Study the pie chart and answer the questions that follow
दिए गए पाई चार्ट एक संगठन में 450 कर्मचारियों के प्रतिशत को दर्शाता है। पाई चार्ट का अध्ययन करें और आने वाले प्रश्नों का उत्तर दें।
What is the central angle of the sector representing the number of employees in department A?
विभाग A में कर्मचारियों की संख्या का प्रतिनिधित्व करने वाले क्षेत्र का केंद्रीय कोण क्या है?
View Solution
