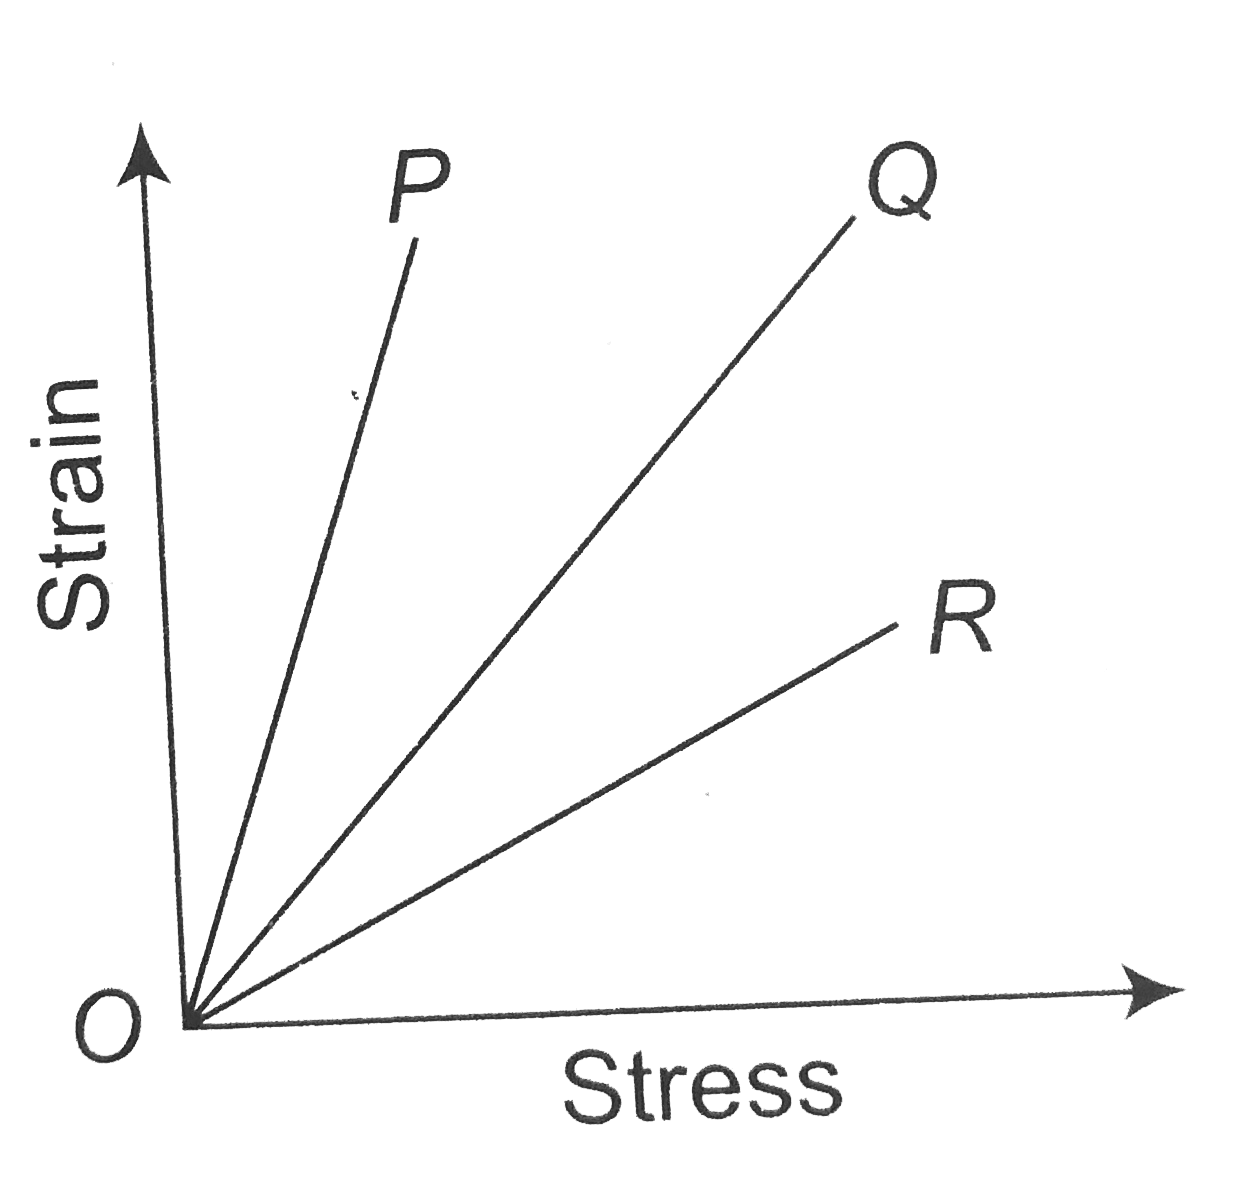
Stress - strain graph of three different are as shown. A,B and C are the Young's modulus of the wires. Which of the following statement is correct ?
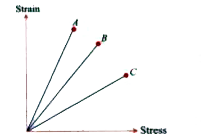
Y of wire a is maximum
Y of wire B is maximum
Tensile strength of C is maximum
None of the above
The correct Answer is:D
As strain is plotted on Y axis and stress is plotted along x axis slope of the graph =1Y or Y=cotθ=1tanθ∝1θ[θ is the angle from stress axis ]
∴YA<YB<YC
Topper's Solved these Questions
- ELASTICITYBook:CENGAGE PHYSICSChapter:ELASTICITYExercise:OLYMPIAD AND NTSE LEVEL EXERCISES
Explore 10 Videos
- ELASTICITYBook:CENGAGE PHYSICSChapter:ELASTICITYExercise:CONSOLIDATED EXERCISE
Explore 5 Videos
- DESCRIPTION OF MOTIONBook:CENGAGE PHYSICSChapter:DESCRIPTION OF MOTIONExercise:OLYMPIAD AND NTSE LEVEL EXERCISE
Explore 10 Videos
- FRICTIONBook:CENGAGE PHYSICSChapter:FRICTIONExercise:OLYMPIAD AND NTSE LEVEL EXERCISES (Read the given statements and select the correct option.)
Explore 1 Video
Similar Questions
Knowledge Check
Stress-strain curve for four metals are shown in figure. The maximum Young's modulus of elasticity is for metal
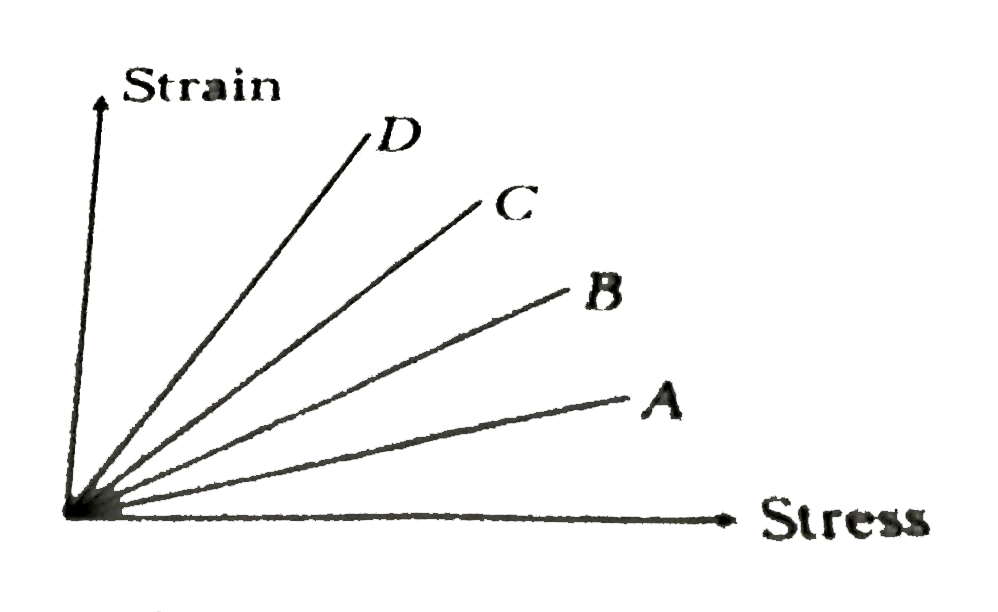 AABBCCDD
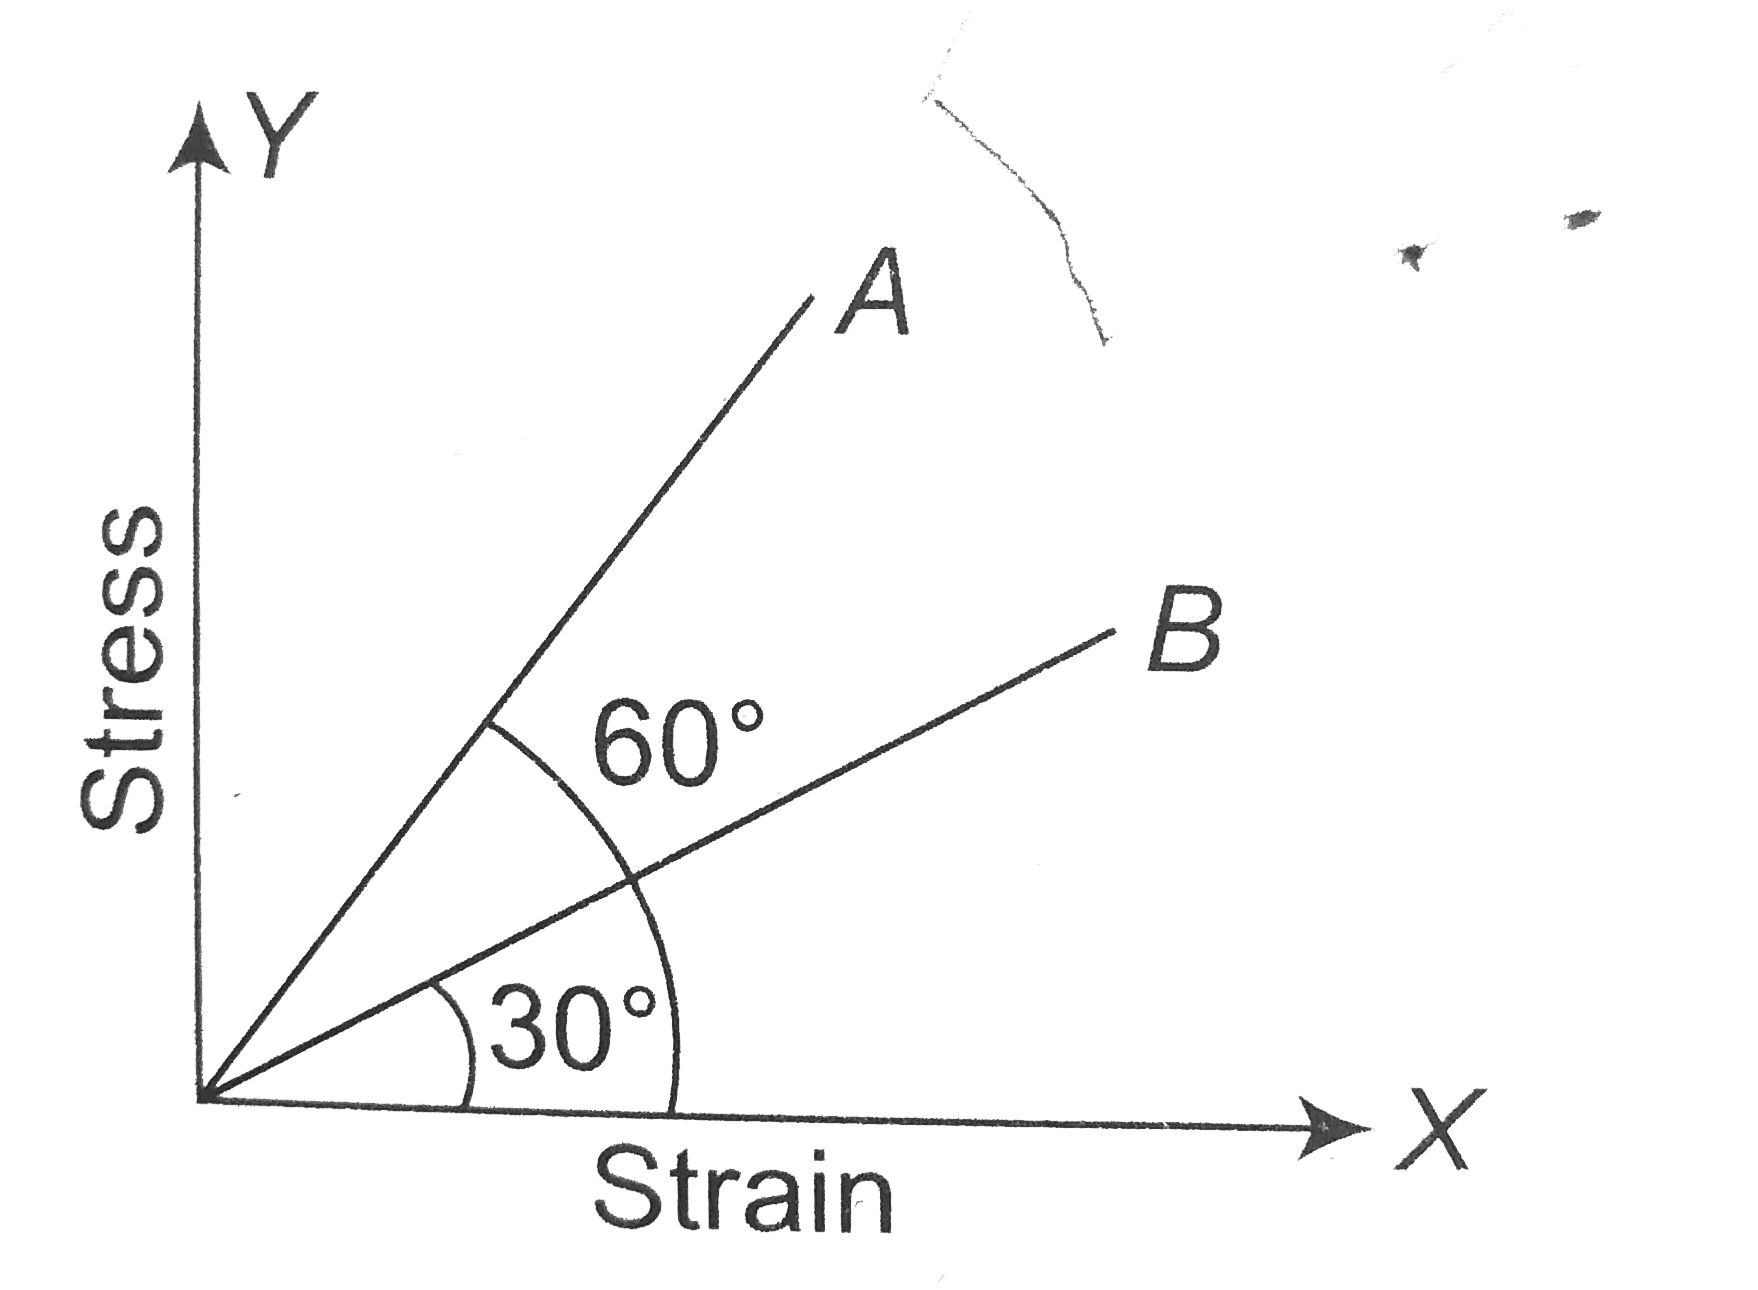
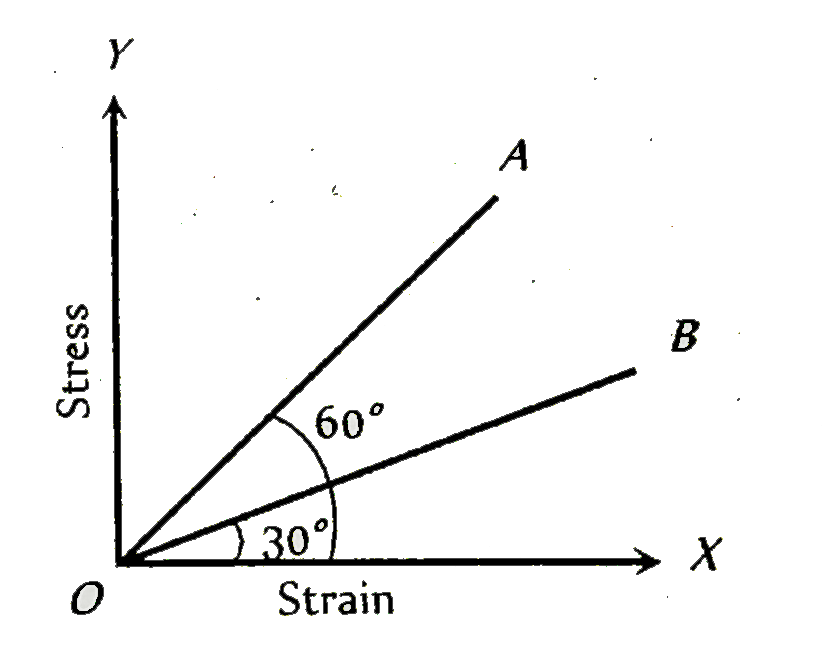
The stress versus strain graphs for wires of two materials A and B are as shown in the figure. If YA and YB are the Young's moduli of the materials thenAYB=2YABYA=YBCYB=3YADYA=3YBThe young’s modulus of a wire is numerically equal to the stress which wire
Anot change the length of the wireBdouble the length of the wireCIncrease the length by 50%Dchange the radius of the wire to half
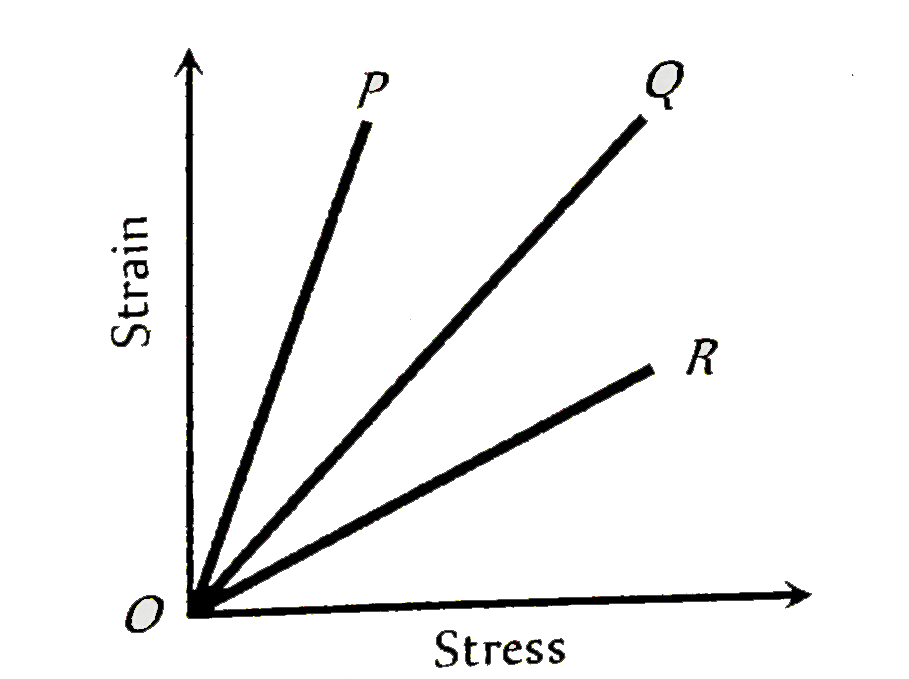
The strain stress curves of three wires of different materials are shown in the figure. P, Q and R are the elastic limits of the wires. The figure shown that
View SolutionThe strain-stress curves of three wire of different materials are shown in the figure. P,Q and R are the elastic limits of the wires. The figures shows that
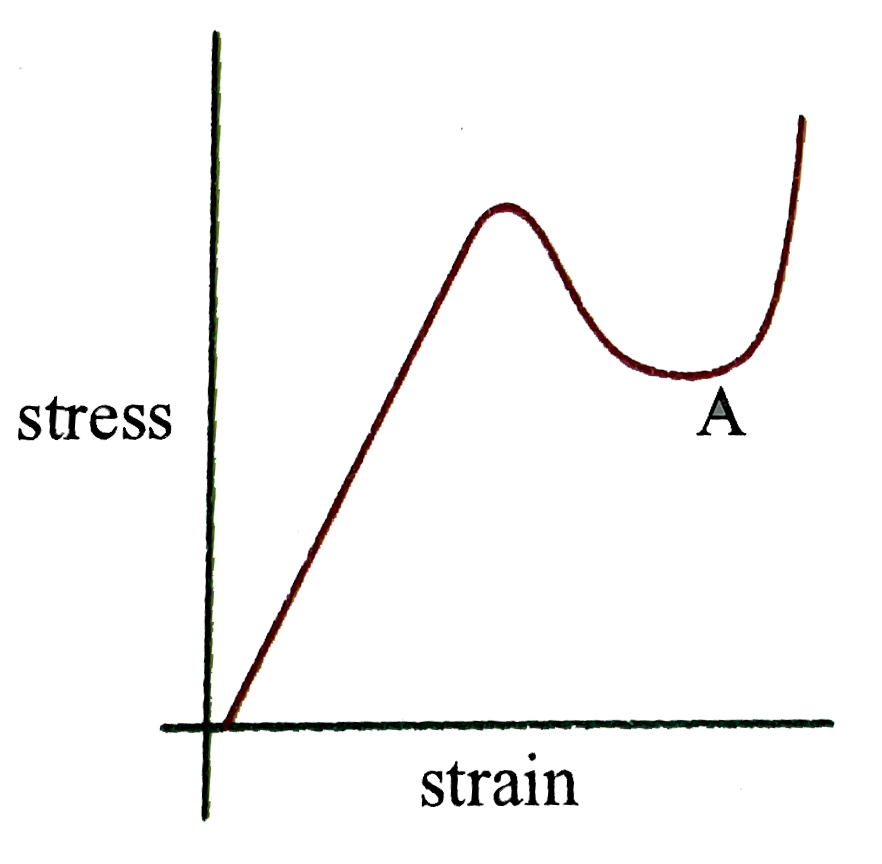
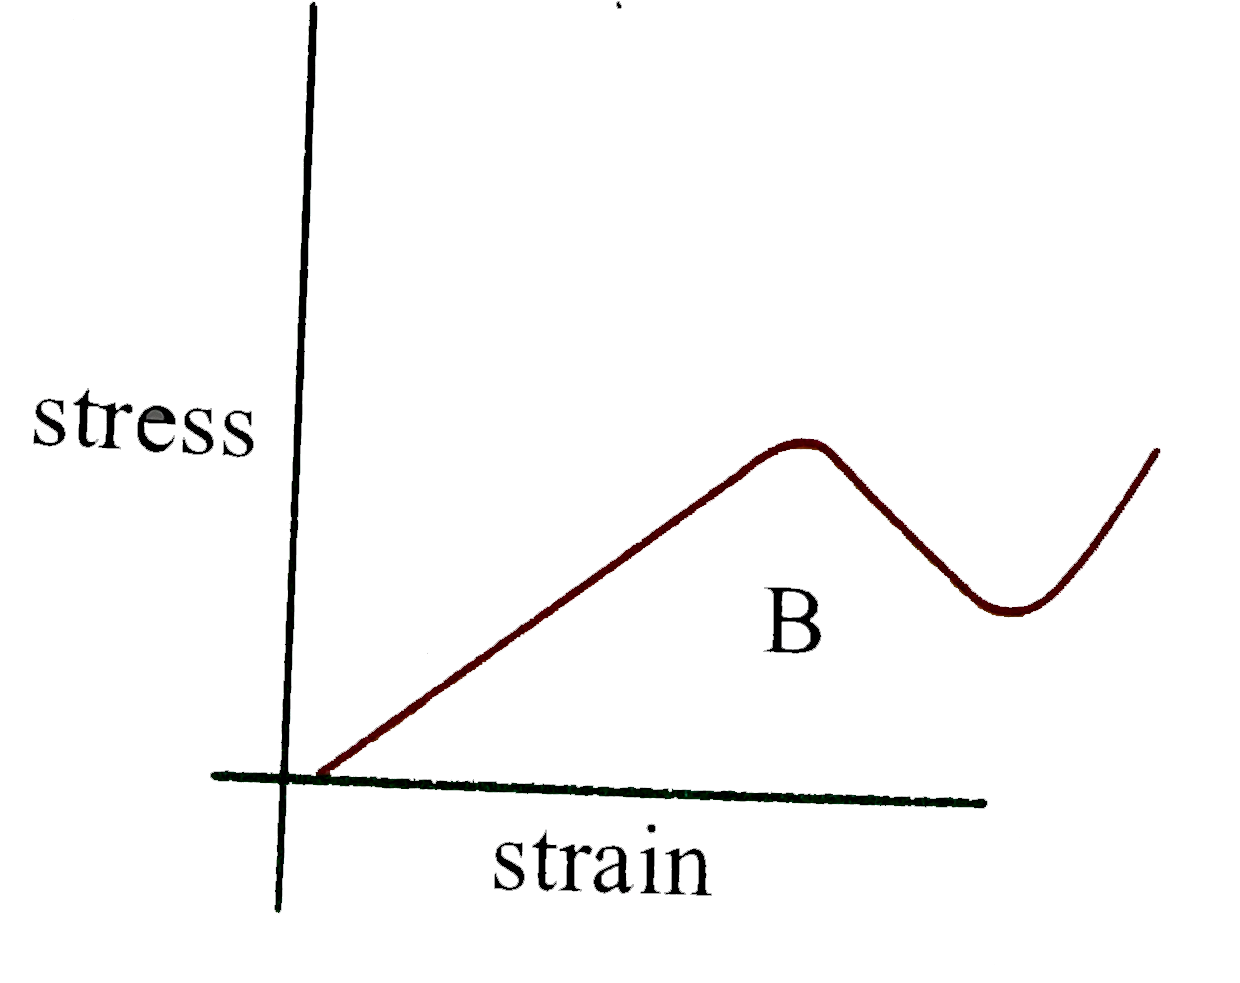
View SolutionThe stress- strain graphs for materials A and B are as shown. Choose the correct alternative
View Solution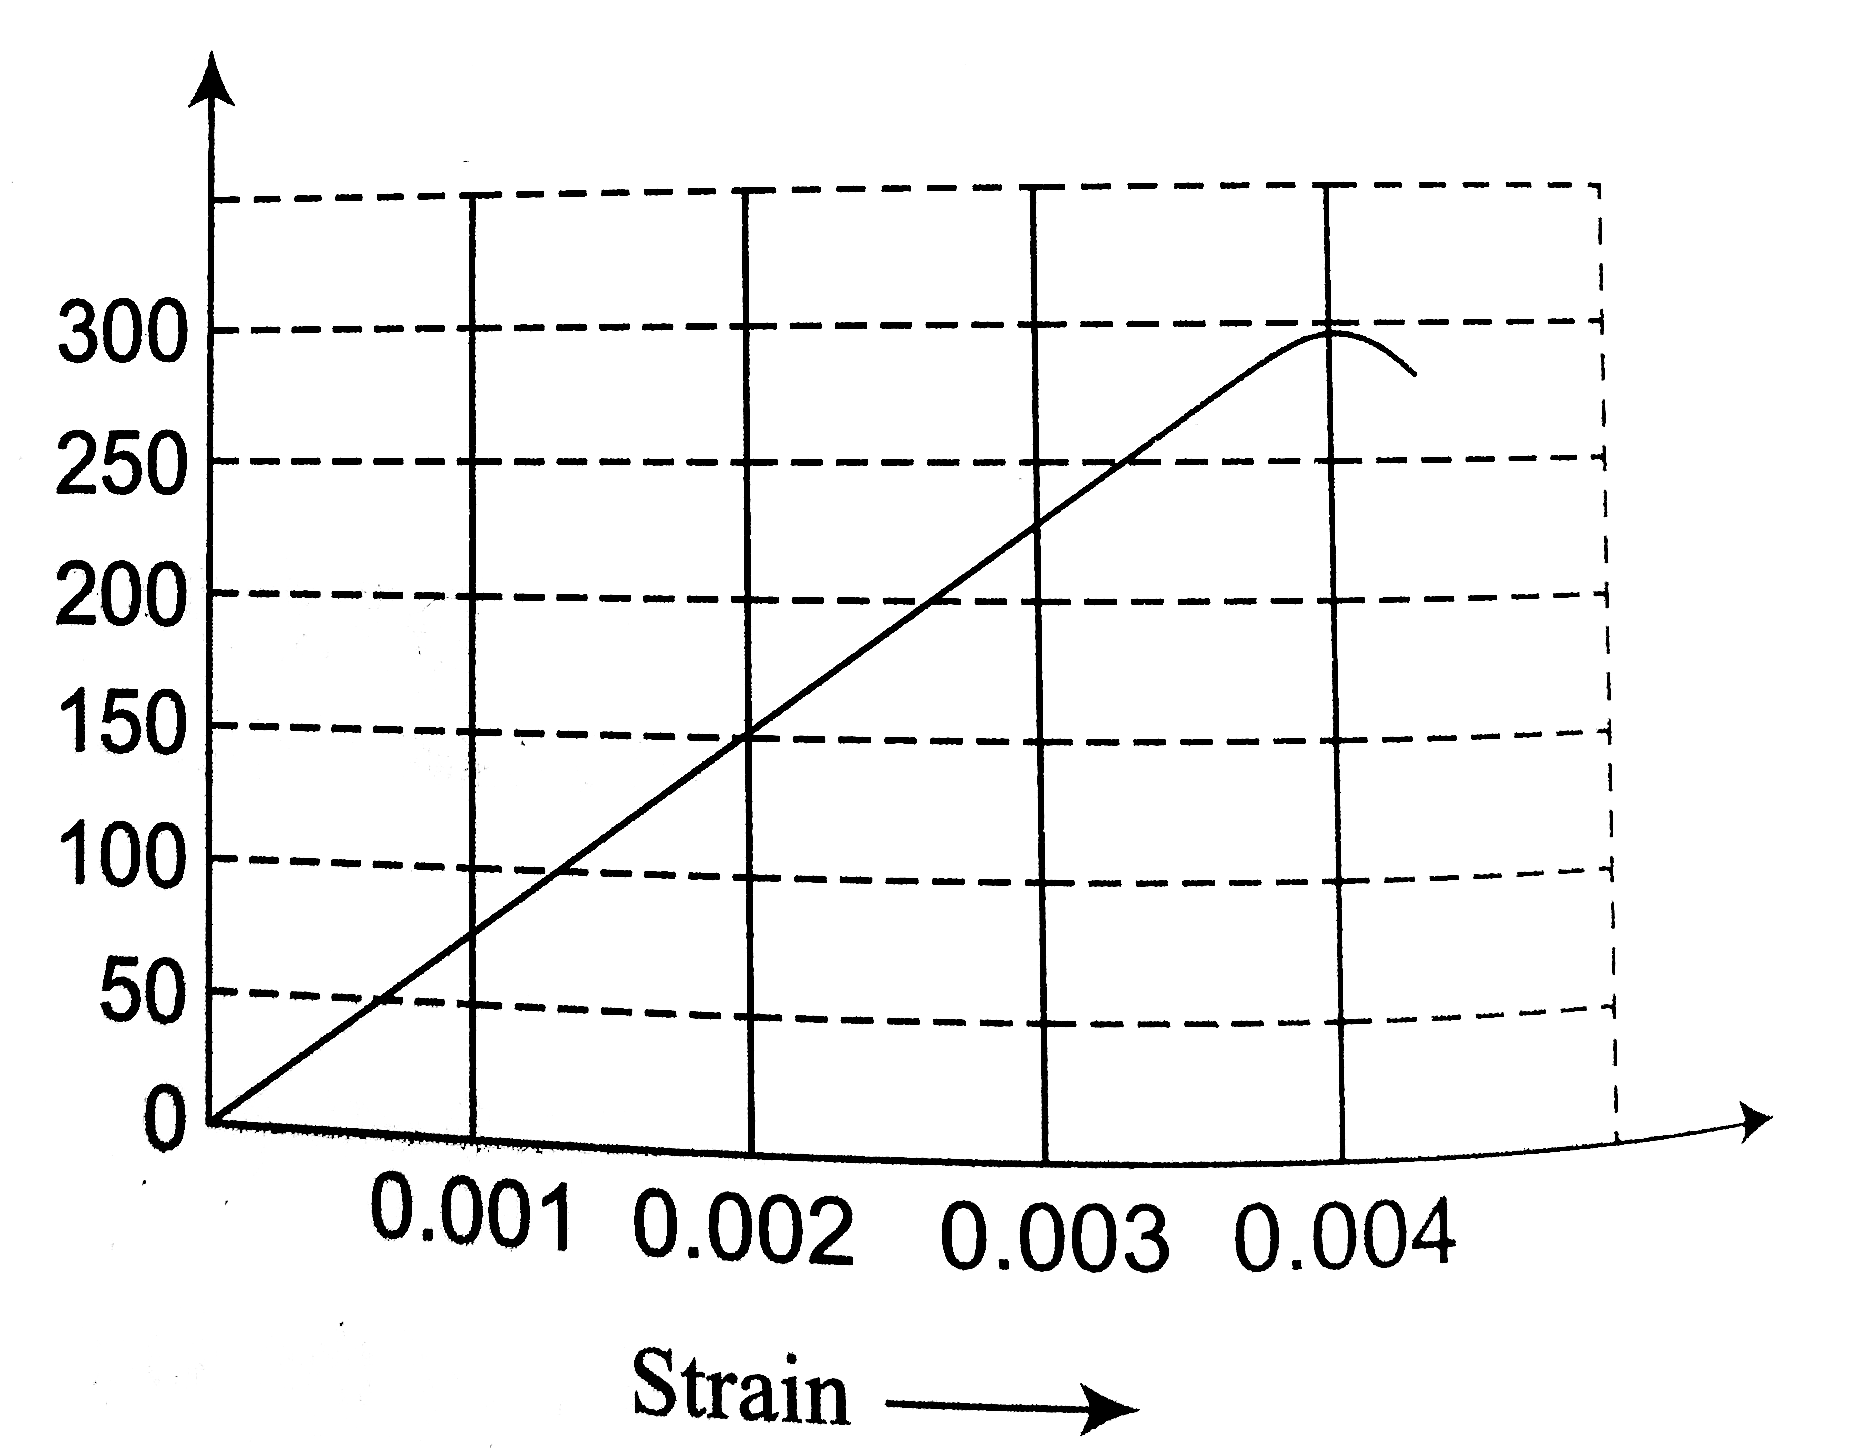
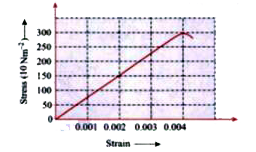
Figure shows the strain stress curve for a given material. The Young's modulus of the material is
View SolutionThe stress versus strain graphs for wires of two materials A and B are as shown in the figure. If YAandYB are the younng's moduli of the materials, then
View Solution


