The number of students in class XI in science, arts and commerce stream of a school over a period of 4 years (2011-2014) has been depicted through the bar chart given below:
 What is the difference between the averages of the number of science and commerce students in the given class over the given period of 4 years?
10
8
12
5
The correct Answer is:D
Step by step video & text solution for The number of students in class XI in science, arts and commerce stream of a school over a period of 4 years (2011-2014) has been depicted through the bar chart given below: What is the difference between the averages of the number of science and commerce students in the given class over the given period of 4 years? by Maths experts to help you in doubts & scoring excellent marks in Class 14 exams.
Updated on:21/07/2023Similar Questions
The number of students in class XI in science, arts and commerce stream of a school over a period of 4 years (2011-2014) has been depicted through the bar chart given below:
4 साल (2011-2014) की अवधि में स्कूल के विज्ञान, कला और वाणिज्य स्ट्रीम में ग्यारहवीं कक्षा में छात्रों की संख्या को नीचे दिए गए दंड आरेख के माध्यम से दर्शाया गया है| What is the difference between the averages of the number of science and commerce students in the given class over the given period of 4 years?
4 वर्ष की दी गई अवधि में दिए गए वर्ग में विज्ञान और वाणिज्य छात्रों की संख्या के औसत के बीच क्या अंतर है
View SolutionThe number of students in class XI in science, arts and commerce stream of a school over a period of 4 years (2011-2014) has been depicted through the bar chart given below:
4 साल (2011-2014) की अवधि में स्कूल के विज्ञान, कला और वाणिज्य स्ट्रीम में ग्यारहवीं कक्षा में छात्रों की संख्या को नीचे दिए गए दंड आरेख के माध्यम से दर्शाया गया है|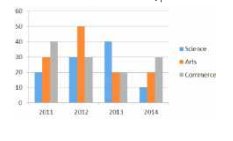 What is the average of the number of arts students in the given class over the given period
of 4 years?
4 वर्ष की दी गई अवधि में दी गई कक्षा में आर्टस के छात्रों की संख्या का औसत कया है
View Solution
Knowledge Check
The number of students in Class XI in Science, Arts and Commerce streams of a school over a period of 4 years (2011-2014) has been depicted through the bar chart given below.
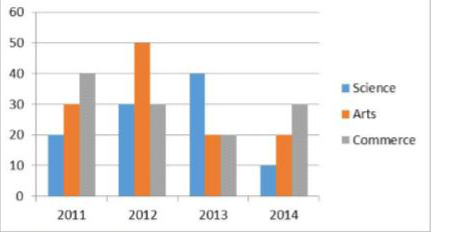
What is the average of the number of Arts students in the given class over the given period of 4 years ?AA)32BB)35CC)30DD)25The bar chart given below shows the number of staff in colleges A and B from years 2011 to 2016.
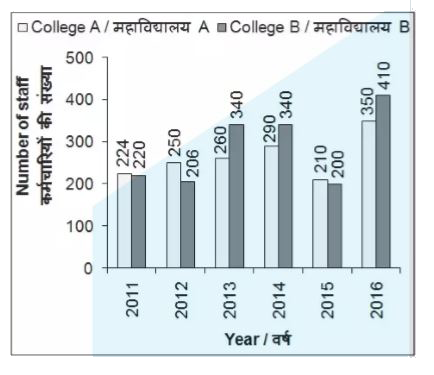
What is the average number of staff in college B in the given six years?A286B280C308D270The bar chart given below shows the number of staff in college A and B from years 2011 to 2016.
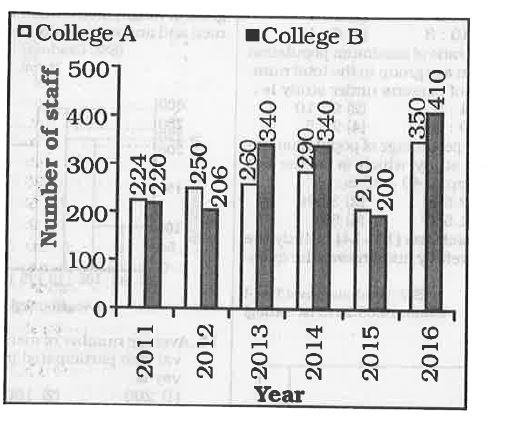
What is the average number of staff in college B in the given six years?A286B280C308D270
The given bar graph, shows the number of students in different classes.
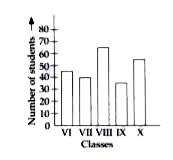
How many more students are there in class VIII than in class IX?
View SolutionThe given bar graph, shows the number of students in different classes.
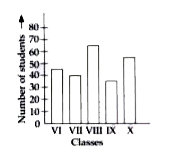
Find the total number of students in the classes VIII to X.
View SolutionThe pie chart given below shows the number of students in 6 different sections. The total number of students is 1800.
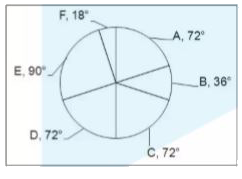
What is the difference between the number of students in section F to the number of students in section C?
View SolutionThe table below shows the number of students enrolled in five colleges over the five years
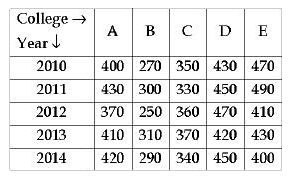
What is the average number of students studying in college D over the given years?
View SolutionThe table given below shows the number of students strudying in five colleges in the given five years.
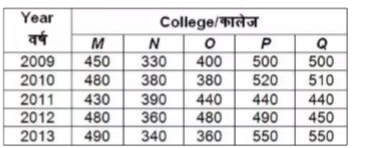
What is the average of the total number of students studying in college M in the given years?
View Solution
