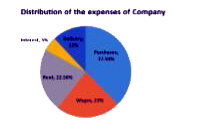
The Pie chart depicts the allocation of the revenue towards the expenses of a particular company. If the company's sales are Rs 4000000 and 75% of the revenue is allocated towards expenses, then what is the total amount spent on Wages and Delivery?
Rs 14,00,000
Rs 10,50,000
Rs 8,75,000
Rs 7,00,000
The correct Answer is:B
Step by step video, text & image solution for The Pie chart depicts the allocation of the revenue towards the expenses of a particular company. If the company's sales are Rs 4000000 and 75% of the revenue is allocated towards expenses, then what is the total amount spent on Wages and Delivery? by Maths experts to help you in doubts & scoring excellent marks in Class 14 exams.
Similar Questions
The pie-chart specifically shows the allocation of revenue for the expenses of a company. If the sales of the company are Rs.4000000 and 75% of the revenue is allocated for expenses, then what is the total amount spent on wages and deliverables?
वृत्त आरेख में विशेष रूप से किसी कंपनी के खर्चों के लिए राजस्व के आबंटन को दर्शाया गया है | यदि कंपनी की बिक्री रु 4000000 है और राजस्व का 75% खर्चों के लिए आवंटित किया जाता है, तो मजदूरी और प्रदेय (डिलीवरी) पर खर्च की गयी कुल राशि कितनी है ?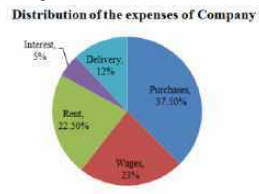 View Solution
The pie-chart shows the breakup in percent age of the various expenses of a Company. Study the diagram and answer the following questions.
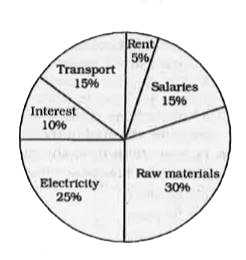
If the total expenses of the company are Rs 50 crores. The total expenditure (in Rs. Crores) on transport and electricity is:View Solution
Knowledge Check
- Question 1 - Select One
Study the pie chart and answer the given questions.
The total expenditure of a company for a particular month is Rs. 60000. The various heads of expenditure I to IV are indicated in a pie chart given below. These heads are :
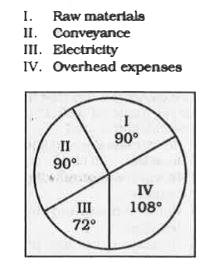
What is the amount spent on overhead expenses?ARs 12,000BRs. 15,000CRs. 18,000DRs. 10,000 - Question 2 - Select One
The pie-chart given below shows the percentage distribution of annual expenditure on various items of a company. The annual expenditure of the company os Rs. 72 crores.
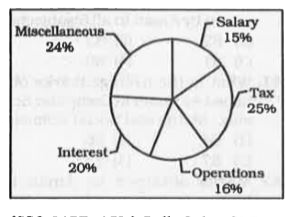
Total amount spent on Raw Material is 50% of the total amount spent on Interest. If the rati of amount of expenditure on Rent and Raw Materials is 1:2 repsectively, then what will be the amount (in Rs.) spent on Rent annually?A28000000B36000000C40000000D32000000 - Question 3 - Select One
The following pie-chart shows the expenditure (in percentage) of five companies P, Q, R, S and T in the year 2016.
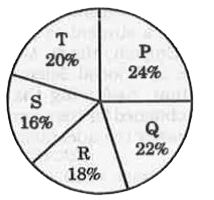
Total amount spent by company S is what percent of total amount spent by companies T and R?A42.1B43C39.68D41
The expenses of a country for a particular year is given in Pie-Chart. Read the Pie-Chart and answer the questions.
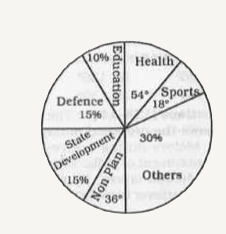
The percent of the total spending that is spent on health isView SolutionThe pie chart, given here shows monthly expenses on various heads and savings of the family of Mr. Rao. Study the chart and answer the questions based on it.
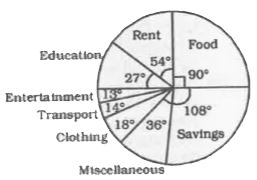
The amount spent on food exceeds the total amount spent on education and clothing byView SolutionThe pie chart, given here shows monthly expenses on various heads and savings of the family of Mr. Rao. Study the chart and answer the questions based on it.
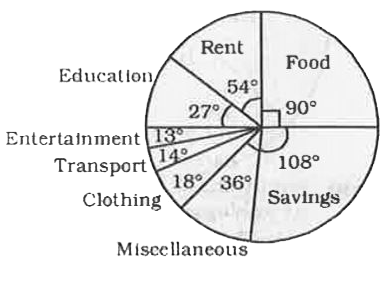
The amount spent on food exceeds the total amount spent on education and clothing byView SolutionThe bar chart given below shows the revenue (in Rs. crores) of company A for the years 2008 to 2015.
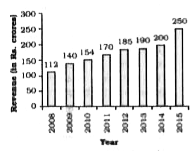
The revenue in 2015 is what per cent of the revenue in 2014?View SolutionThe pie chart given below shows the monthly expenses on various heads of a family . The total expenditure of the family is Rs 30000.
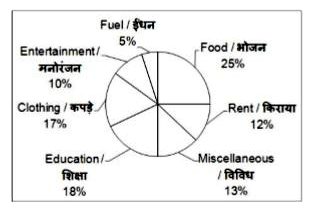
What is the total amount (in Rs) spent on fuel and education ?View Solution
