The line chart given below shows the number of students who have taken admission in college A and B from the years 2010 to 2015 .
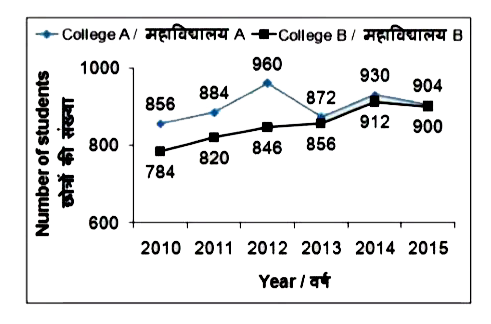
The difference between the number of students in both colleges is maximum in which year?
2010
2012
2014
2015
The correct Answer is:A, B
Step by step video, text & image solution for The line chart given below shows the number of students who have taken admission in college A and B from the years 2010 to 2015 . The difference between the number of students in both colleges is maximum in which year? by Maths experts to help you in doubts & scoring excellent marks in Class 14 exams.
Updated on:21/07/2023Similar Questions
The line chart given below shows the number of students who have taken admission in college A and B from the years 2010 to 2015 .
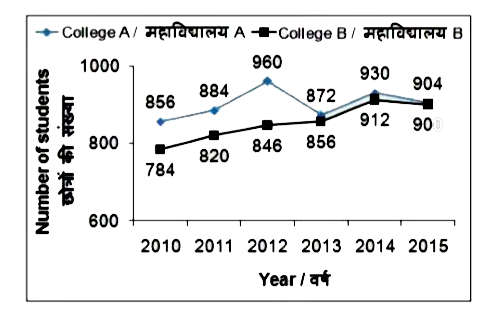
In how many years, the number of students in college A is less than the average number of students in college B across all the years?
View SolutionThe line chart given below shows the number of students who have taken admission in college A and B from the years 2010 to 2015 .
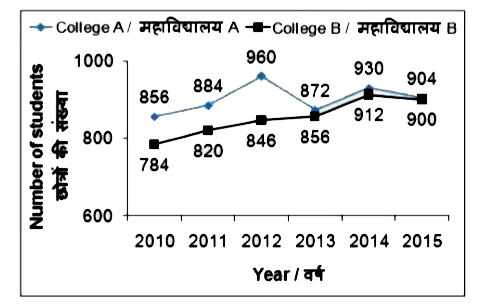
What percentage of seats remained vacant in college B in 2015 if the capacity was 1000?
View Solution
Knowledge Check
The table given below shows the number of students who have taken admission in school A and B from the years 2010 to 2015.
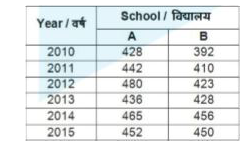
The difference between the number of students in both schools is maximum in which year?Aa)2010Bb)2012Cc)2014Dd)2015The line chart given below shows the number of students who have taken admission in college A and B from the years 2010 to 2015 .
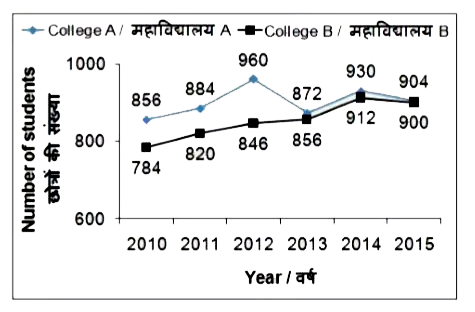
What is the average difference of number of students in college A and B in the given period?A24B48C96D144The table given below shows the number of students who have taken admission in school A and B from the years 2010 to 2015.
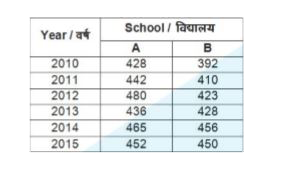
What is the average difference of number of students in school A and B in the given period?Aa)24Bb)27Cc)96Dd)144
The table given below shows the number of students who have taken admission in school A and B from the years 2010 to 2015.
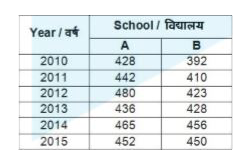
Across all the years, for how many years, the number of students in school A was less than the average number of students in school B?
View SolutionThe bar chart given below shows the number of students (in '00) in a schoool from year 2000 to year 2004.
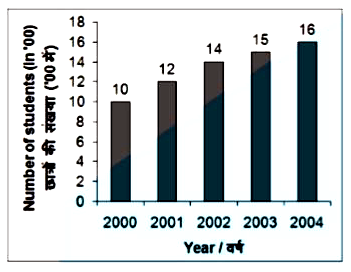
What is the difference between the total number of students in year 2004 and 2000?
View SolutionThe table given below shows the number of students who have taken admission in school A and B from the years 2010 to 2015.
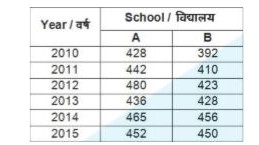
If the total student intake capacity for School B was 500 then what percentage of seats remained vacant in school B in 2015?
View SolutionThe line chart given below shows the number of students in 2 sections X and Y from year 2009 to 2016.
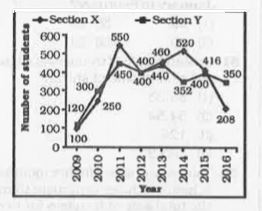
What is the percentage change in the number of students in section Y from year 2011 to year 2015?
View SolutionThe bar chart given below shows the number of staff in colleges A and B from years 2011 to 2016.
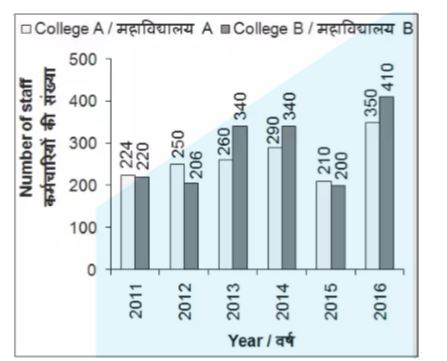
For how many years the number of staff in college B is more than the number of staff in college A?
View Solution
