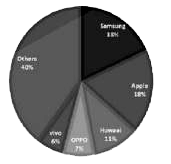
यह पाई आरेख वर्ष 2017 में विभिन्न मोबाइल कंपनियों द्वारा की गई कुल बिक्री को दर्शाता है। यदि वर्ष 2017 में कुल बिक्री ₹ 5000 करोड़ है, तब ओप्पो कंपनी द्वारा की गई बिक्री ₹ ___ करोड़ है।
2000
900
350
550
The correct Answer is:C
Step by step video, text & image solution for यह पाई आरेख वर्ष 2017 में विभिन्न मोबाइल कंपनियों द्वारा की गई कुल बिक्री को दर्शाता है। यदि वर्ष 2017 में कुल बिक्री ₹ 5000 करोड़ है, तब ओप्पो कंपनी द्वारा की गई बिक्री ₹ ___ करोड़ है। by Maths experts to help you in doubts & scoring excellent marks in Class 14 exams.
Updated on:21/07/2023Similar Questions
The following line diagram represents the yearly sales figure of a company in the years 2001-2010. Examine the diagram and answer the question. निम्नलिखित रेखा आरेख किसी कंपनी की वर्ष 2007-2010 के दौरान वार्षिक बिक्री के आंकड़ों को दर्शाता है। आरेख का अध्ययन करें और नीचे दिए गए प्रश्नों के उत्तर दें- ............................................................................................................................................. Total sales (in crore of Rs.) from 2005 to 2008 is वर्ष 2005 से वर्ष 2008 तक कुल बिक्री (रु. करोड में) है-
View SolutionThe given bar chart shows the details of cycle sales by a company between January and May for years 2017 and 2018.
दिया गया दंड आरेख वर्ष 2017 एवं 2018 में एक कंपनी के द्वारा जनवरी से लेकर मई तक साइकिल बिक्री की जानकारी देता है |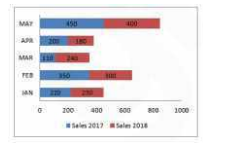 In the given bar-chart, which month sales show the maximum decrease in 2018 as compared to 2017?
दिए गए दंड आरेख में, किस माह की बिक्री 2017 की तुलना में 2018 में अधिकतम कमी को दर्शाती है ?
View SolutionThe given bar chart shows the details of cycle sales by a company between January and May for years 2017 and 2018.
दिया गया दंड आरेख वर्ष 2017 एवं 2018 में एक कंपनी के द्वारा जनवरी से लेकर मई तक साइकिल बिक्री की जानकारी देता है |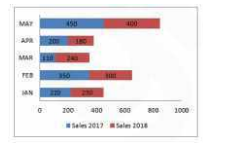 In the given bar-chart, which month sale shows the maximum increase in 2018 as against 2017?
/ दिए गए दंड आरेख के नुसार किस महीने की बिक्री 2017 की तुलना में 2018 में अधिकतम वृद्धि दर्शाती है ?
View SolutionThe given pie chart shows the quantity wise sales distribution of five products (A, B, C, D and E) of a company in 2016.
दिया गया पाई चार्ट 2016 में एक कंपनी के पाँच उत्पादों ( A, B, C, D और E ) की मात्रा वार बिक्री का वितरण दर्शाता है |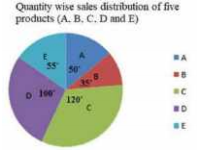 If 1500 units of product D were sold in 2016 and the total number of units sold by the company in
2017 was 18% more than that sold in 2016, then the total units sold by the company in 2017 is:
यदि 2016 में वस्तु D की 1500 इकाइयाँ बेचीं गयीं और 2017 में कंपनी द्वारा बेचीं गयी इकाइयों की कुल संख्या 2016 में बेचीं गयी इकाइयों की कुल संख्या से 18% अधिक थी, तो 2017 में कंपनी द्वारा बेची गयी कुल इकाइयों की संख्या है
View SolutionThe given Bar Graph presents Income and Expenditure (in crores of Rupees) of a company for the five years, 2014 to 2018. दिया गया दंड आरेख पांच वर्षों अर्थात 2014 से 2018 तक एक कंपनी के आय एवं व्यय ( करोड़ रुपये में ) को दर्शाता है | What is the ratio of total Expenditure to total Income of the company in 2014, 2016 and 2017? 2014, 2016 और 2017 में कंपनी के कुल व्यय और कुल आय में क्या अनुपात है ?
View SolutionThe given Bar Graph presents the sales of the number of books (in thousands) by six benches of a publishing company during two consecutive years 2000 and 2001. दिया गया दंड आरेख लगातार दो वर्षों : 2000 और 2001 में एक प्रकाशन कंपनी की छः शाखाओं के द्वारा बेची गयी पुस्तकों की संख्या ( हज़ार में ) दर्शाता है | The ratio of total sales by all branches for the year 2001 to total sales by all branches for the year 2000 is: वर्ष 2001 में सभी शाखाओं की कुल बिक्री का वर्ष 2000 में सभी शाखाओं की कुल बिक्री के साथ अनुपात ज्ञात करें|
View SolutionThe Bar Graph shows the Profit (Rupees in Lakhs) earned by two companies P and Q during the period 2011 to 2017.
यह दंड आरेख दो कंपनियों P एवं Q के द्वारा 2011 से 2017 की अवधि में कमाए गए लाभ ( लाख रुपये में ) को दर्शाता है |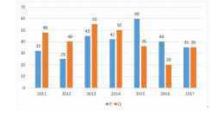
In which year company P earns the maximum profit as compared to the previous year?
किस वर्ष कंपनी P को पिछले वर्ष की तुलना में अधिकतम लाभ हुआ है ?
View SolutionThe given bar graph shows the production and sale of mobile handsets of five different companies A, B, C, D, E, & F during the period of one month. दंड आरेख विभिन्न कंपनियों A, B, C, D, E & F की एक माह में मोबाइल हैंडसेट के उत्पादन और बिक्री को दर्शाता है | The units sold by the companies A, B and C, taken together, is approximately what percent of the total units produced by the companies A, B and C ? (to the nearest integer ) कंपनी A, B और C द्वारा कुल मिलाकर बिक्री की गई यूनिटें, कंपनी A, B और C द्वारा मिलाकर उत्पादित कुल यूनिटों का लगभग कितना प्रतिशत है (निकटतम पूर्णाक तक)?
View Solution
