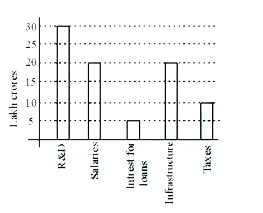
निचे दिया गया ग्राफ वित्तीय वर्ष 2015-16 के लिए विभिन्न शीर्षकों के तहत सार्बजनिक क्षेत्र की कंपनी 'ABC' के व्यय को प्रदर्शित करता है।

वर्ष 2015-16 के लिए कंपनी 'ABC ने किस क्षेत्र में सर्वोच्च व्यय किया है?
इंफ्रास्ट्रक्चर
अनुसंधान एवं विकास
कर
विक्रय
The correct Answer is:B
Step by step video, text & image solution for निचे दिया गया ग्राफ वित्तीय वर्ष 2015-16 के लिए विभिन्न शीर्षकों के तहत सार्बजनिक क्षेत्र की कंपनी 'ABC' के व्यय को प्रदर्शित करता है। वर्ष 2015-16 के लिए कंपनी 'ABC ने किस क्षेत्र में सर्वोच्च व्यय किया है? by Maths experts to help you in doubts & scoring excellent marks in Class 14 exams.
Similar Questions
The following table shows the items of expenditure of a company (in ₹ lakh per annum), from 2015 to 2019.
निम्नलिखित तालिका 2015-2019 तक एक कंपनी के व्यय की मदों को ( लाख रुपये प्रति वर्ष में ) दर्शाती है | What is the average amount of interest per year which the company had to pay during this
period?
इस अवधि के दौरान प्रति वर्ष कंपनी को ब्याज की कितनी औसत राशि का भुगतान करना पड़ा है ?01:33View Solutionराष्ट्र्वादी कवी रामधारीसिंह 'दिनकर' को 'उर्वशी' के लिए 'ज्ञानपीठ - पुरस्कार ' किस वर्ष प्रदान किया गया ?
02:16View SolutionThe given Bar Graph presents Income and Expenditure (in crores of Rupees) of a company for five years, 2014 to 2018. In which year is the Expenditure more than 40% as compared to the Expenditure in the previous year? दिया गया दंड आरेख (बार ग्राफ) 5 वर्षो, 2014 से 2018 के दौरान किसी कंपनी की आय और व्यय (करोड़ रुपए में) को दर्शाता है| पिछले वर्ष के व्यय की तुलना में किस वर्ष में वह 40% अधिक है?
04:39View SolutionThe given Bar Graph presents Income and Expenditure (in crores of Rupees) of a company for five years, 2014 to 2018. What is the ratio of total Expenditure to total Income of the company in 2014,2016 and 2017? दिया गया दंड आरेख (बार ग्राफ) 5 वर्षों, 2014 से 2018 के दौरान किसी कंपनी की आय और व्यय (करोड़ रुपए में) को दर्शाता है| 2014, 2016 और 2017 में कंपनी के कुल व्यय और कुल आय का अनुपात क्या है?
01:43View SolutionThe given Bar Graph presents the Revenue and Expenditure (in crores of Rupees ) of a company during the five year period , 2014 - 2018. दिया गया दंड आरेख (bar graph) 5 वर्ष की अवधि 2014-2018 के दौरान किसी कंपनी के राजस्व और व्यय (करोड़ रुपए में ) को दर्शाता है। The expenditure of the company in 2017 is what percentage less than the average revenue ( per year ) in 2014, 2015 and 2016 ? वर्ष 2017 में कंपनी का व्यय, वर्ष 2014, 2015 और 2016 में औसत राजस्व (प्रति वर्ष) से कितने प्रतिशत कम है?
01:42View SolutionThe given Bar Graph presents the Revenue of Expenditure (in crores of rupees) of a company during the five year period, 2014 - 2018. दिया गया दंड आरेख (Bar graph) 5 वर्ष की अवधि 2014-2018 के दौरान किसी कंपनी के राजस्व और व्यय (करोड़ रुपए में) को दर्शाता है| वर्ष 2016 से 2018 तक कंपनी का कुल व्यय, 5 वर्ष की अवधि के कुल राजस्व का कितना प्रतिशत )पूर्णांक के करीब है)? The total expenditure of the company from 2016 - 2018 is what percentage (nearest to an integer) of the total revenue of the five year period?
01:32View Solutionएल्कीनों की असंतृप्तता के परीक्षण के लिए किस अभिकर्मक का उपयोग किया जाता है?
View SolutionCo3+ के संकुलों के लिए दृश्य क्षेत्र में अवशोषण की तरंगदैर्ध्य के लिए बढ़ता हुआ सही क्रम है :
View Solution
