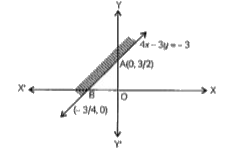
The shaded area represents students in a normal distribution who fall
at
between
after
between
The correct Answer is:C
Step by step video, text & image solution for The shaded area represents students in a normal distribution who fall by Cdp experts to help you in doubts & scoring excellent marks in Class 14 exams.
Updated on:21/07/2023Topper's Solved these Questions
- IDENTIFYING AND ADDRESSING THE TALENTED CREATIVE AND SPECIALLY ABLED LEARNERSBook:ARIHANT PUBLICATION PUNJABChapter:IDENTIFYING AND ADDRESSING THE TALENTED CREATIVE AND SPECIALLY ABLED LEARNERSExercise:CHAPTER EXERCISE
Explore 38 Videos
- IDENTIFYING AND ADDRESSING THE TALENTED, CREATIVE SPECIALLY-ABLED LEARNERSBook:ARIHANT PUBLICATION PUNJABChapter:IDENTIFYING AND ADDRESSING THE TALENTED, CREATIVE SPECIALLY-ABLED LEARNERSExercise:Chapter exercise
Explore 35 Videos
Similar Questions
Knowledge Check
The shaded area represents students in a normal distribution who fall
 Aat σ=0Bbetween 2σ−3σCafter 3σDbetween σ=2σ
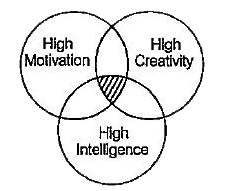
The shaded portion represents.
AA group of professional peopleBA group of Engineers and Professors who are Lawyers
 CA group of Engineers and Lawyers who are also Doctors and Professors a·s well.DNone of these
The shaded region is represented by the inequality:
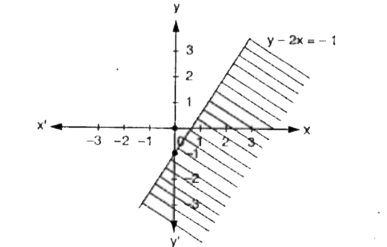 Ay−2x≤−1Bx−2y≤−1Cy−2x≥−1Dx−2y≥−1
Shaded region is represented by
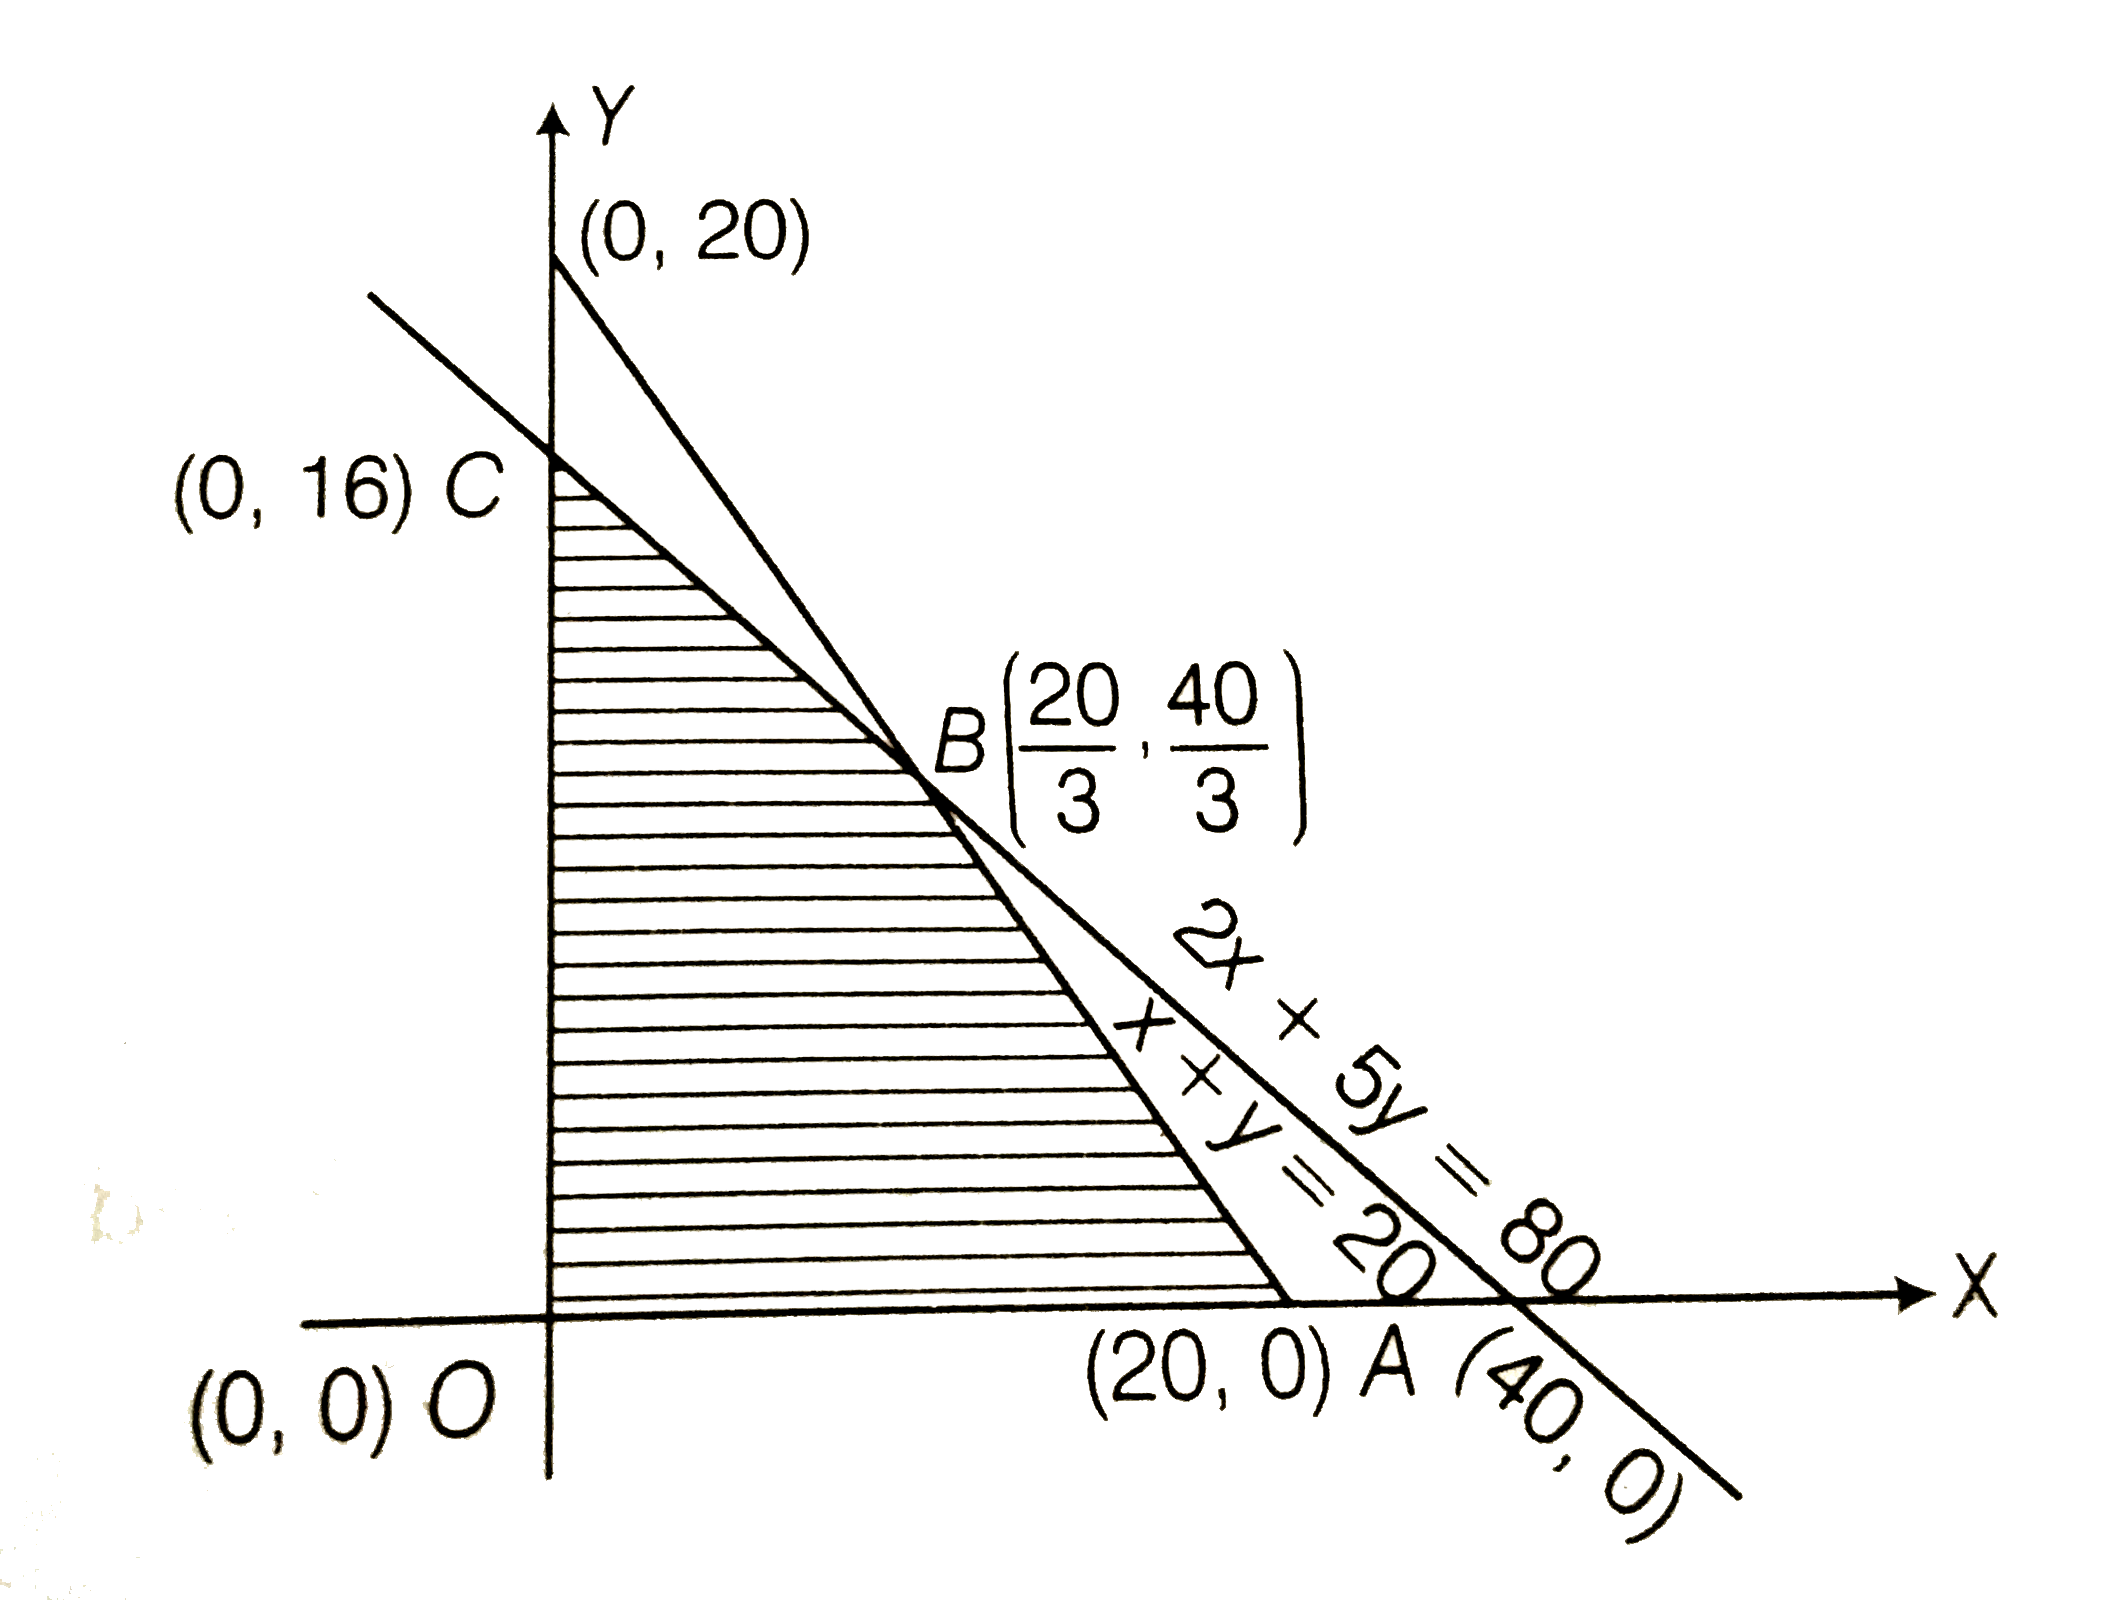
View SolutionThe circle graph represents a total of 240 animals. The shaded area represents the number of monkeys. How many of the animals are monkeys ?
View SolutionThe shaded region is represented by the inequation:
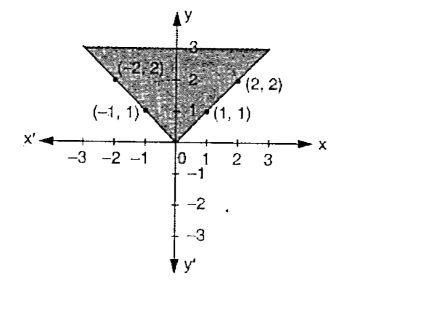
View SolutionThe given Venn diagram represents results of a class students:
The triangle represents students who scored 85% and above in Maths, the circle represents students who scored 85% and above in English, the rectangle represents students who scored 85% and above in Science, and the square represents students who scored 85% and above in Social Science. The numbers given in the diagram represent the number of students in that particular category.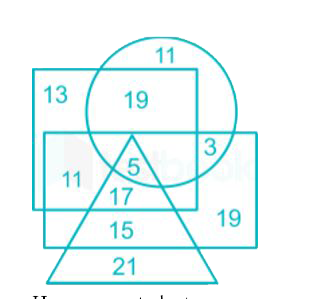
How many students scored 85% and above in all the subjects?
View SolutionThe diagram represents the students who are singers, dancers and poets :

Study the diagram and identify the region which represents the students who are both poets and singers but not dancers :
View Solution

