Read the following pie and bargraph carefully and answer the questions given below.
Income of seven companies in a state in the year 2001
Total income of all companies = ₹ 3500 cr.
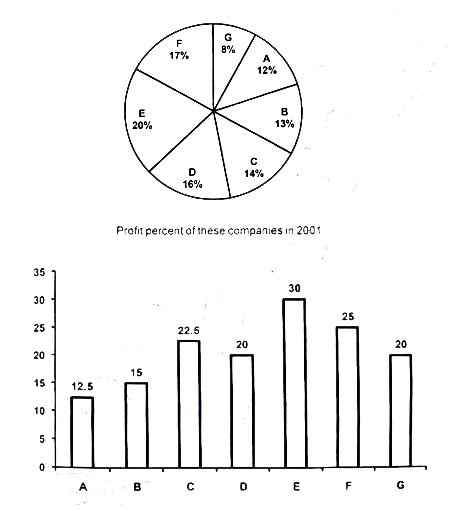
What was expenditure of company F in 2001 ?
₹ 450 cr
₹ 456 cr
₹ 476 cr
₹ 480 cr
The correct Answer is:C
Step by step video, text & image solution for Read the following pie and bargraph carefully and answer the questions given below. Income of seven companies in a state in the year 2001 Total income of all companies = ₹ 3500 cr. What was expenditure of company F in 2001 ? by Maths experts to help you in doubts & scoring excellent marks in Class 14 exams.
Updated on:21/07/2023Topper's Solved these Questions
Similar Questions
Read the following graph carefully and answer the questions given below.
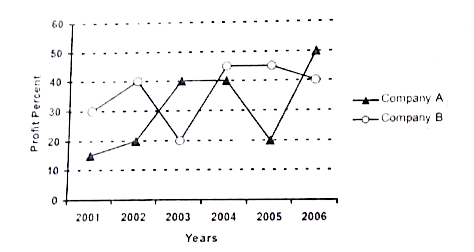
If income of company B in the year 2006 is Rs. 28 cr. what is the profit of the company in the same year?
View SolutionRead the following graph carefully and answer the questions given below.
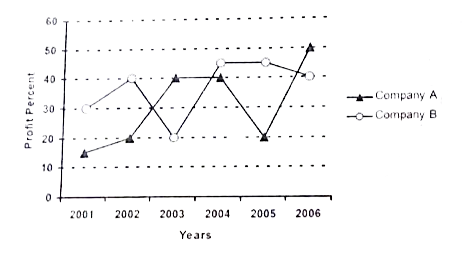
If income of company A in the year 2002 was Rs 20 cr. What is the approximate expenditure of the company in the same year ?
View Solution
Knowledge Check
Read the following pie and bargraph carefully and answer the questions given below.
Income of seven companies in a state in the year 2001
Total income of all companies = ₹ 3500 cr.
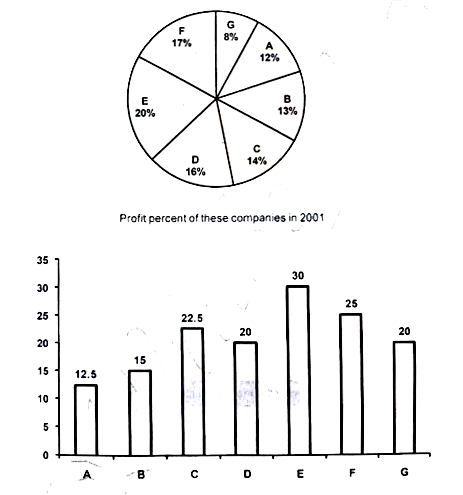
What is the total expenditure of companies C and G together ?A₹ 500 crB₹ 700 crC₹ 750 crD₹ 633 crRead the following pie and bargraph carefully and answer the questions given below.
Income of seven companies in a state in the year 2001
Total income of all companies = ₹ 3500 cr.
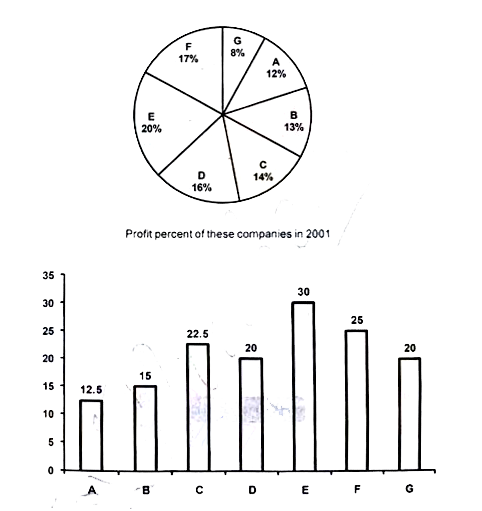
Which of the following companies has made maximum profit (in terms of ₹) in 2001 ?AEBFCDDGRead the following pie and bargraph carefully and answer the questions given below.
Income of seven companies in a state in the year 2001
Total income of all companies = ₹ 3500 cr.
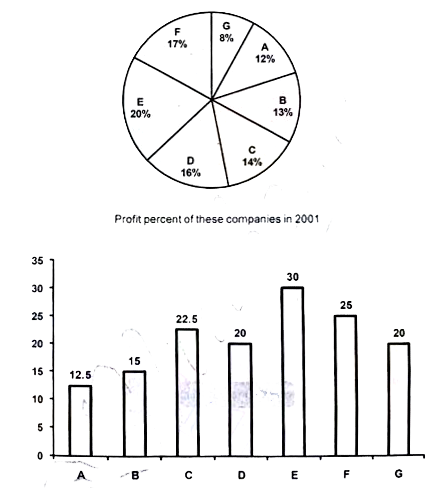
Which of the following two companies has made the same profit in 2001 ?AB and GBB and ACA and GDD and C
Read the following graph carefully and answer the questions given below.
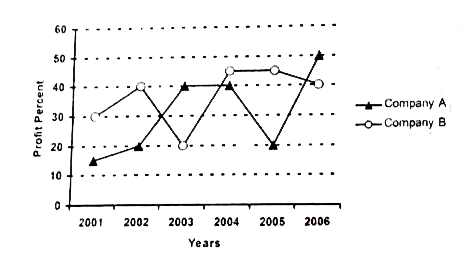
In which year the average of the profit percent of the both companies was the maximum ?
View SolutionRead the following graph carfully and answer the questions given below. Production of bulbs by different companies in three years (In lakhs)
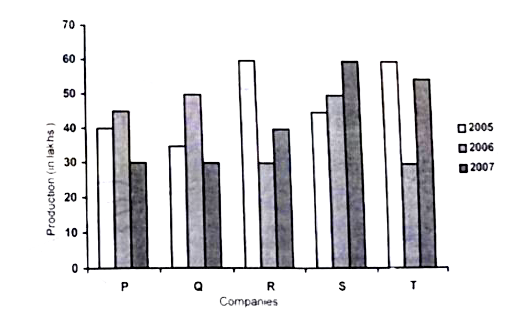
What was the total production of all companies together in the year 2005 ?
View SolutionRead the following graph carfully and answer the questions given below. Production of bulbs by different companies in three years (In lakhs)
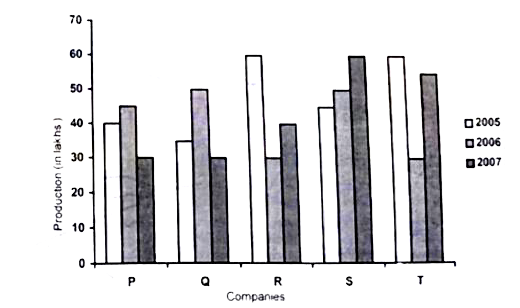
What is the ratio of average production of company Q to the average production of company T in all the given years?
View SolutionRead the following pie and bargraph carefully and answer the questions given below.
Income of seven companies in a state in the year 2001
Total income of all companies = ₹ 3500 cr.
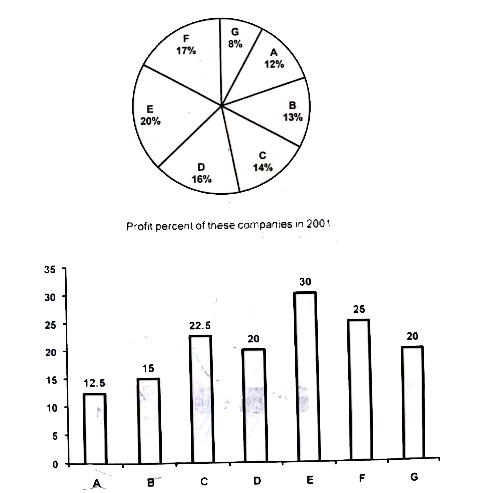
Half of the combined income of all the seven companies consists of total incomes of which combination of companies ?
View SolutionStudy the following graph carefully and answer the given questions :-
The following graph shows the % profit of two companies over the years :-
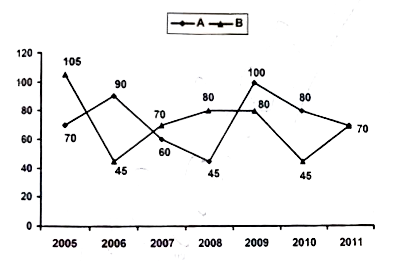
If the total income of company B in 2011 was Rs 200 lakhs what was the expenditure of company A in the same year ?
View Solution
