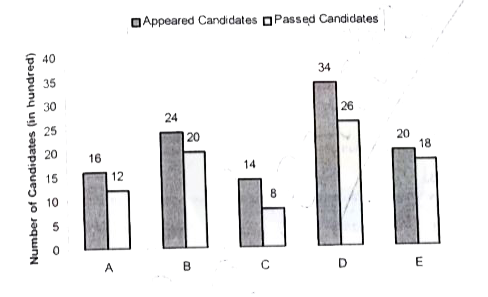
Study the following graph and answer the questions that follows:-
Number of appeared candidates and passed Candidates (in hundreds) in a test from five different institutions.
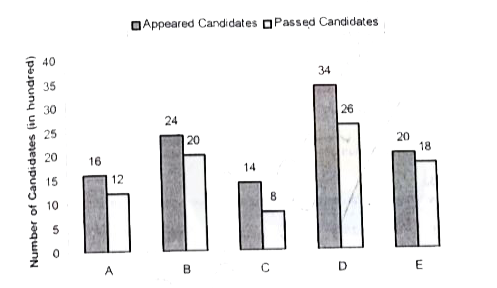
What is the ratio between the number of candidates appeared from institutions A, C and E together and candidates passed from B, D and E together? a)25:8 b)6:11 c)4:7 d)25:32
25:8
6:11
4:7
32:7
The correct Answer is:D
Step by step video, text & image solution for Study the following graph and answer the questions that follows:- Number of appeared candidates and passed Candidates (in hundreds) in a test from five different institutions. What is the ratio between the number of candidates appeared from institutions A, C and E together and candidates passed from B, D and E together? a)25:8 b)6:11 c)4:7 d)25:32 by Maths experts to help you in doubts & scoring excellent marks in Class 14 exams.
Updated on:21/07/2023Topper's Solved these Questions
Similar Questions
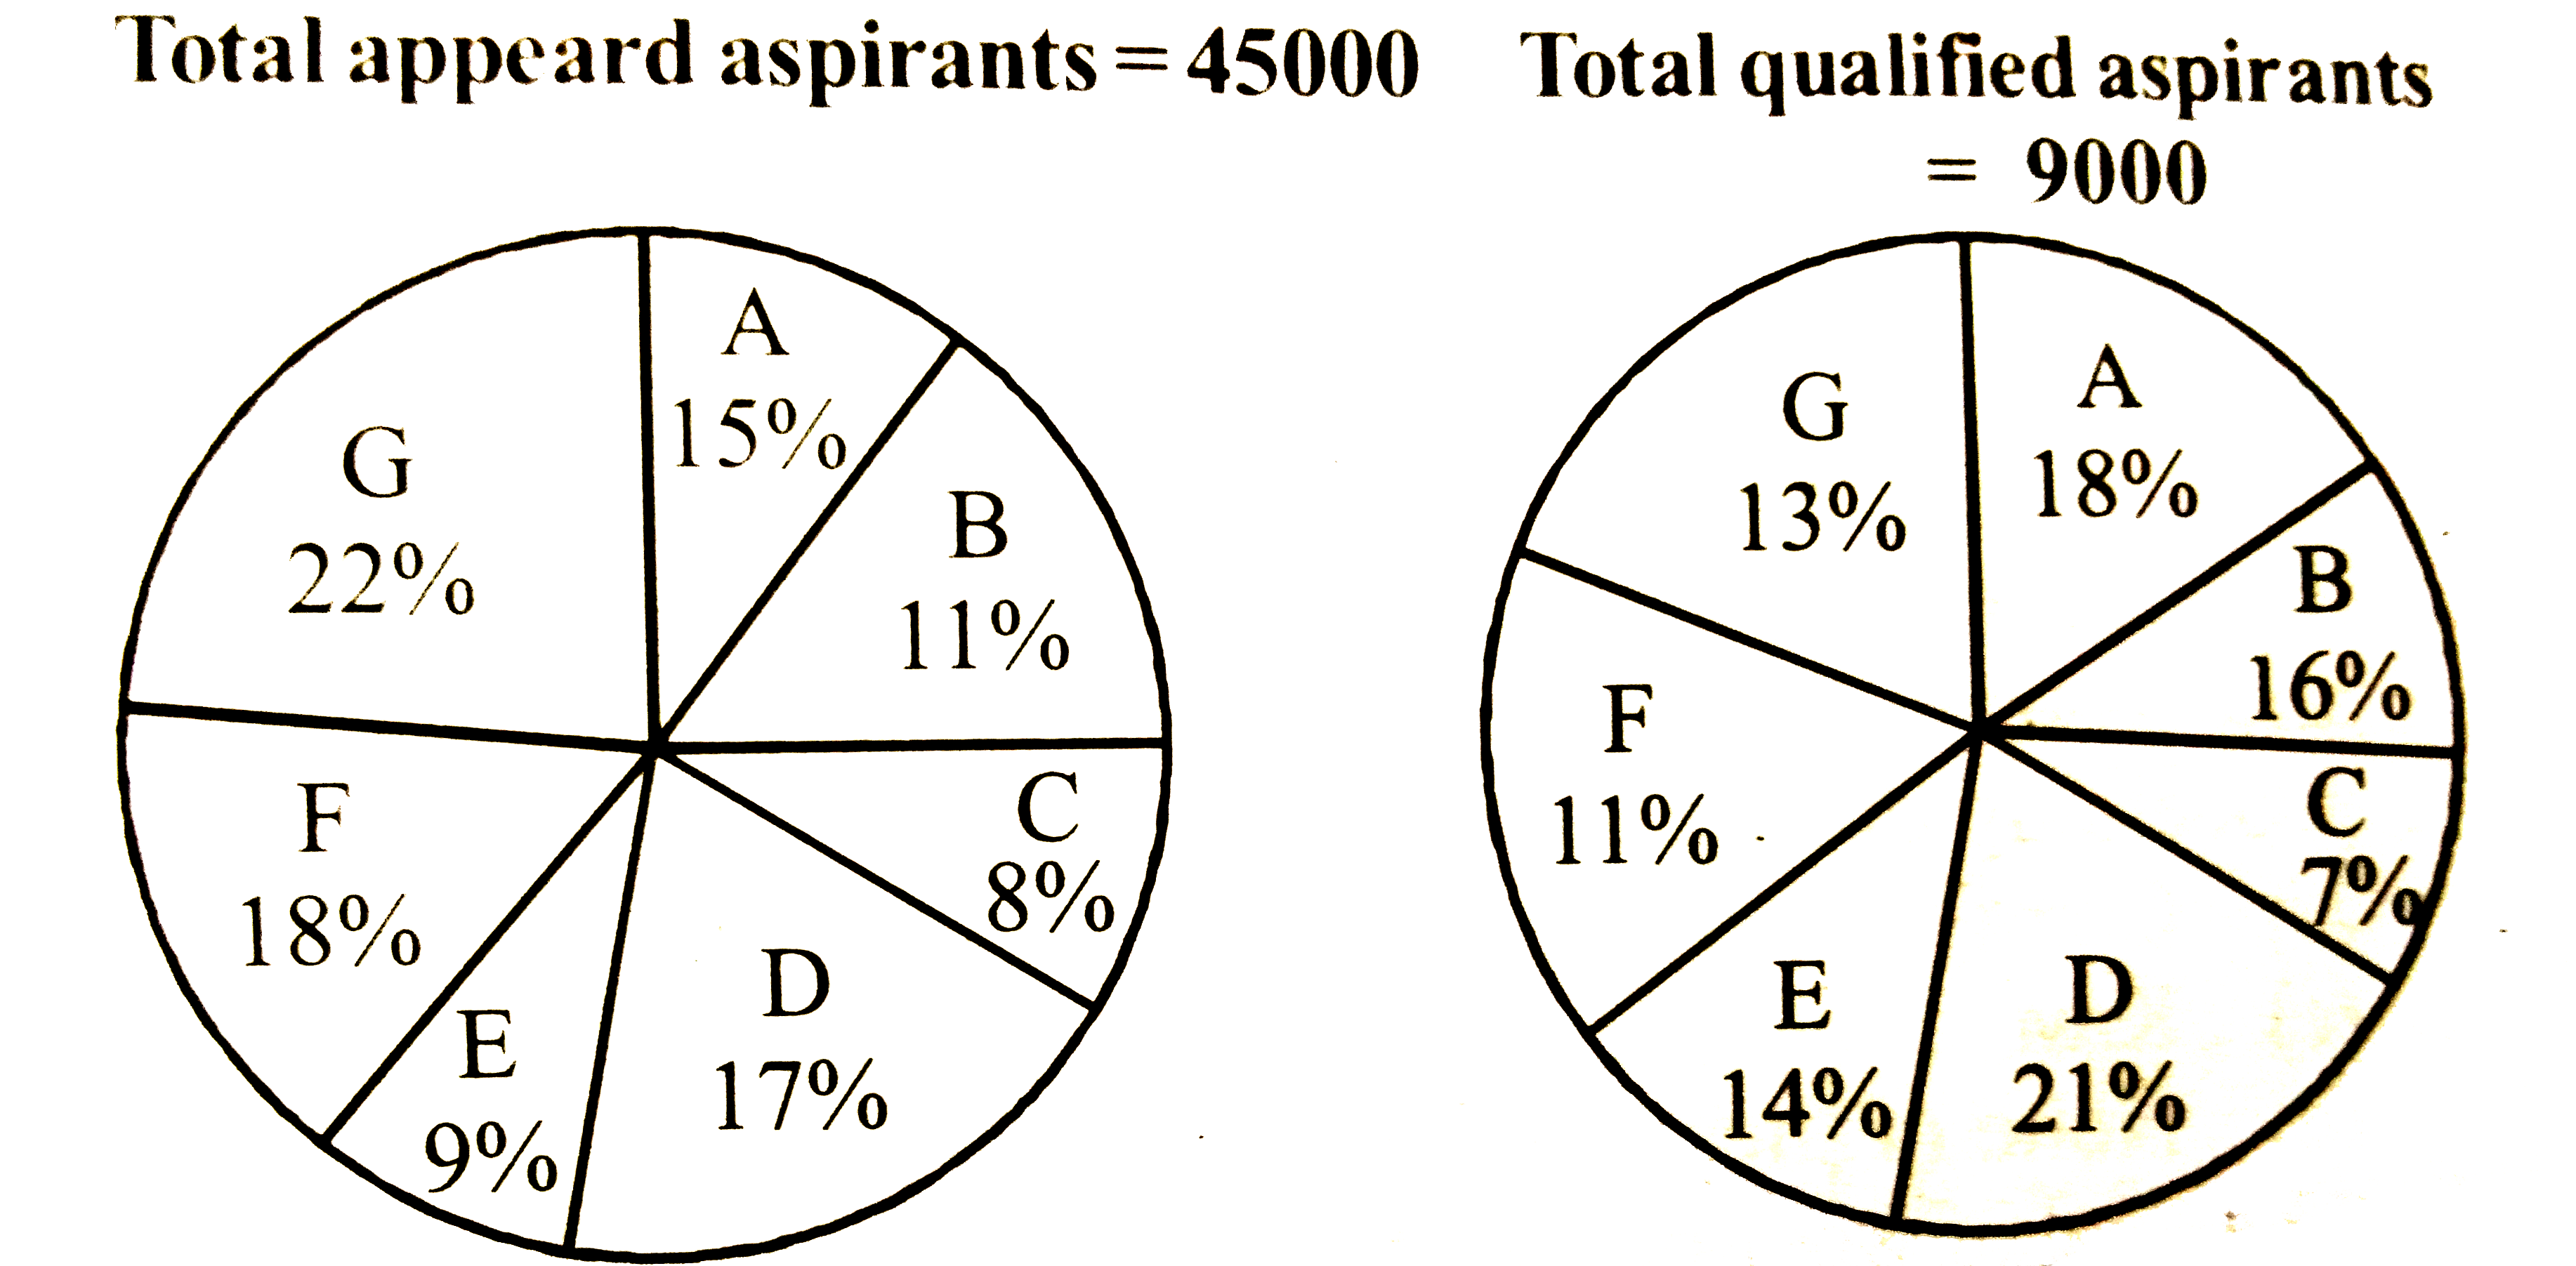
What is the ratio between number of candidates qualified from States B and D together and the number of candidats appeard from States 'C' respectivey ?
View Solution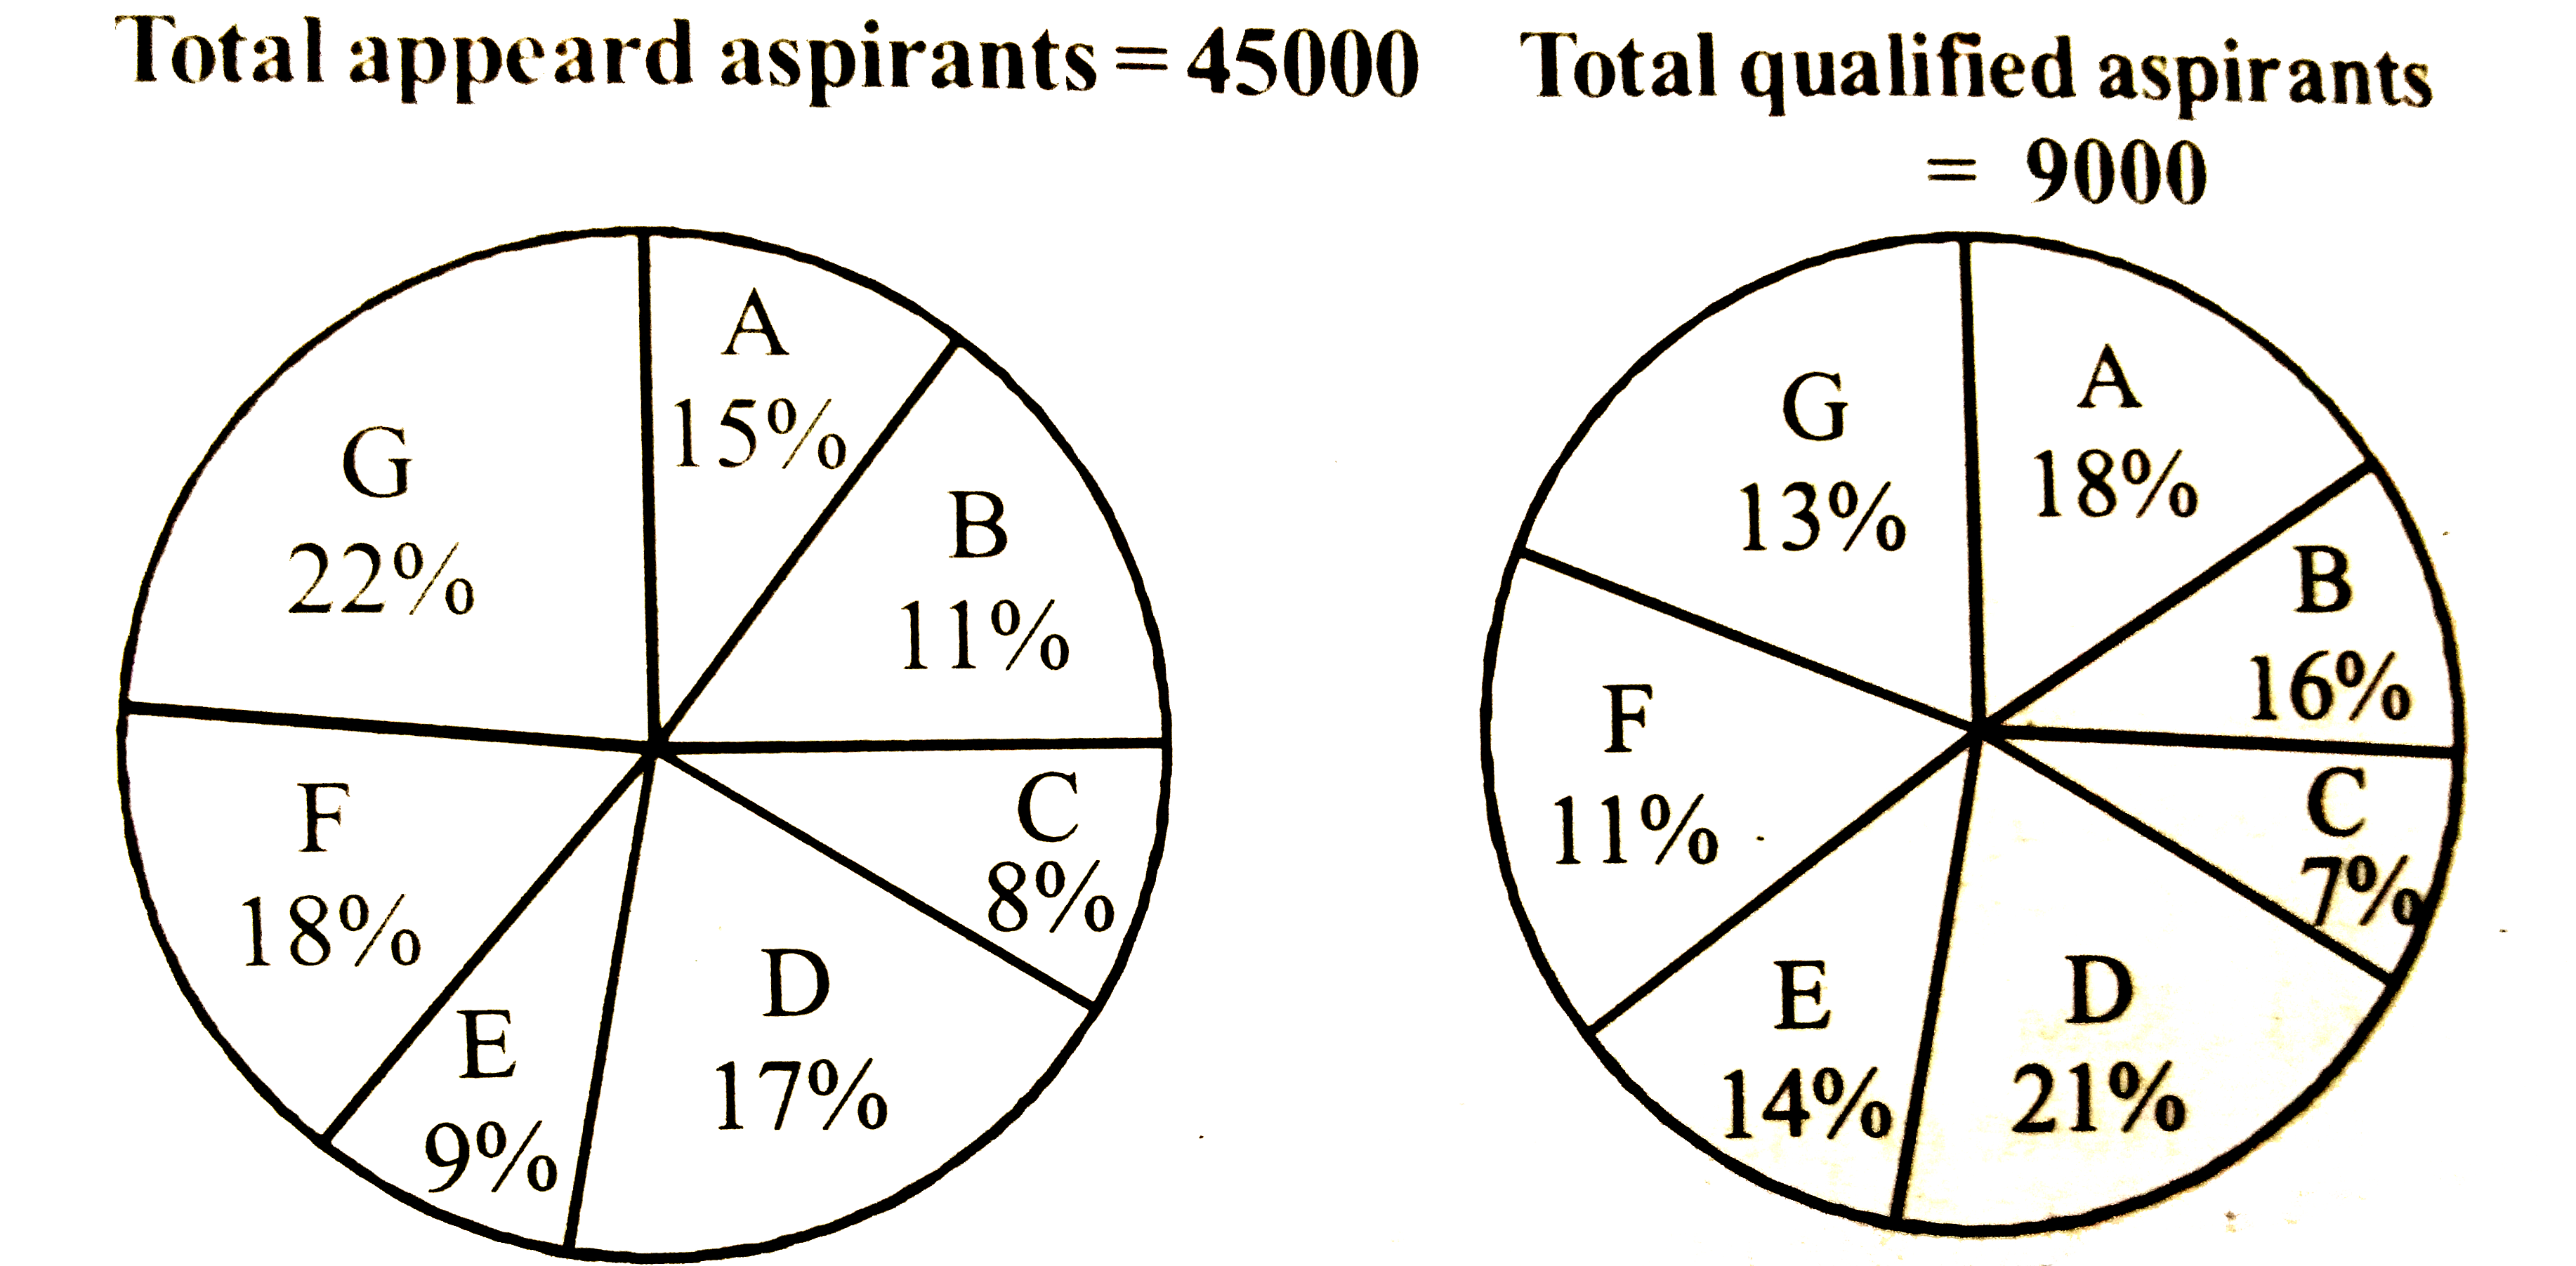
What is the ratio of the number of appeared aspirants from States C and E together to that of the appeared aspirants from States A and F together ?
View Solution
Knowledge Check
Study the following graph and answer the questions that follows:-
Number of appeared candidates and passed Candidates (in hundreds) in a test from six different institutions.
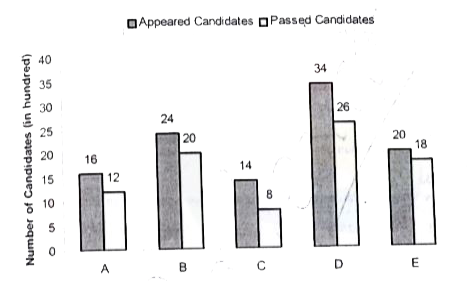
What is the average number of candidates passed from all the institutions together?A1400B1500C1200Dnone of theseStudy the following graph and answer the questions that follows:-
Number of appeared candidates and passed Candidates (in hundreds) in a test from six different institutions.
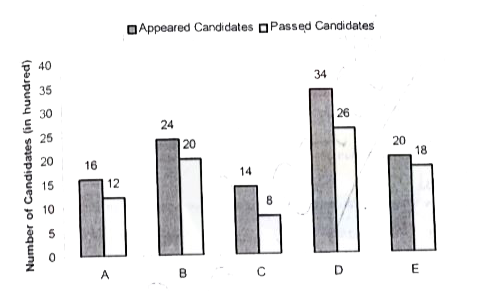
What is the respective ratio between the number of candidates who have failed from institution B and the number of candidates who have appeared from institutions E ?A3:7B1:3C1:5D3:4Study the following graph and answer the questions that follows:-
Number of appeared candidates and passed Candidates (in hundreds) in a test from six different institutions.
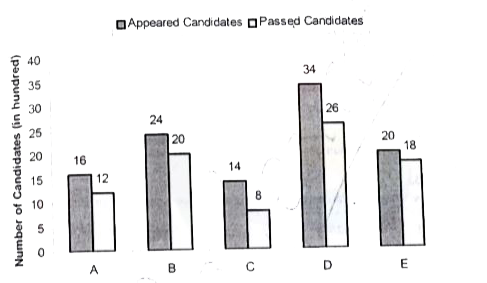
From which institution the difference between the appeared candidates and passed candidates is maximum?ADBACBDC

What is the ratio of number of students passed from institute F in 2003 to the number of students passed from institute B in 2005
View SolutionStudy the following graph and answer the questions that follows:-
Number of appeared candidates and passed Candidates (in hundreds) in a test from six different institutions.
Number of candidates passed from institutions C and D together is approximately what percentage of the total number of candidates appeared from institutions B and E together?
View SolutionStudy the following pie chart carefully gives the answer-
Classification of appeared candidates in a competitive test from different institutes and qualified candidates.
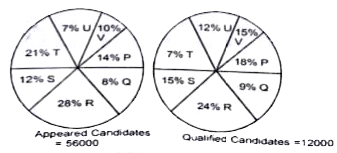
What is the ratio between the number of candidates two qualified from institutes P and R together to the no. of candidates who appeared from institutes Q and V together ?
View SolutionWhat is the total number of candidates clearing the entrance exam from states E and F together in the year 2006?

View SolutionStudy the following graph carefully and answer the question given below
Number of candidates appeared (in thousand) and percentage of candidates qualified in a competitive examination over the years.
No. of candidates appeared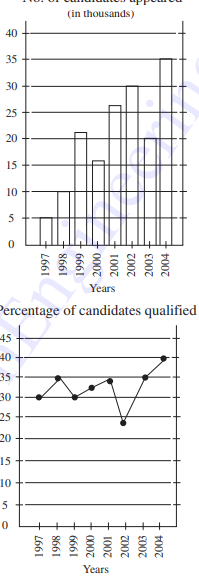
What was the ratio between the number of candidates appeared in 1997 and the number of candidates qualified in 2004?
View Solution
