निम्नलिखित चित्र को देखें और नीचे दिए गए प्रश्नों के उत्तर दें।
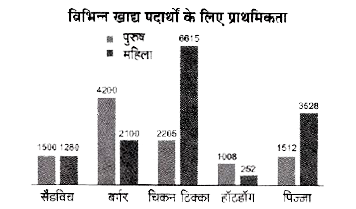
नीचे दिया गया चार्ट होटल में पाँच विभिन्न खाद्य पदार्थों पर एक सर्वेक्षण के परिणामों को दर्शाता है।
विभिन्न खाद्य पदार्थों के लिए प्राथमिकता

सैंडविच पसन्द करने वाले और हॉटडॉग पसन्द करने वाले लोगों का अनुपात ज्ञात करें।
117:23
27:59
54:23
139:63
The correct Answer is:D
Step by step video, text & image solution for निम्नलिखित चित्र को देखें और नीचे दिए गए प्रश्नों के उत्तर दें। नीचे दिया गया चार्ट होटल में पाँच विभिन्न खाद्य पदार्थों पर एक सर्वेक्षण के परिणामों को दर्शाता है। विभिन्न खाद्य पदार्थों के लिए प्राथमिकता सैंडविच पसन्द करने वाले और हॉटडॉग पसन्द करने वाले लोगों का अनुपात ज्ञात करें। by Maths experts to help you in doubts & scoring excellent marks in Class 14 exams.
Updated on:21/07/2023Similar Questions
विभिन्न प्रकार के खाद्य पदार्थों मे क्या होता है ?#!#स्टार्च का परीक्षण
View SolutionThe following line diagram represents the yearly sales figure of a company in the years 2001-2010. Examine the diagram and answer the question. निम्नलिखित रेखा आरेख किसी कंपनी की वर्ष 2007-2010 के दौरान वार्षिक बिक्री के आंकड़ों को दर्शाता है। आरेख का अध्ययन करें और नीचे दिए गए प्रश्नों के उत्तर दें- The ratio of sales in 2002 to that in 2007 is वर्ष 2002 में बिक्री का वर्ष 2007 में बिक्री के साथ अनुपात है-
View SolutionThe pie-chart provided below gives the distribution of land (in a village) under various food crops. Study the pie-chart carefully and answer the questions. नीचे दिए गए वृत्तारेखा में विभिन खाद्य फसलों के ( एक गाँव में ) भूमि का वितरण दिखाया गया हैं। वृत्तारेखा का अध्ययन कीजिए और प्रश्नों के उत्तर दीजिए। The ratio of the land used for rice and barley is चावल और जौ के उत्पादन के लिए प्रयुक्त भूमि का अनुपात है-
View Solutionदोहरान |भोजन |विभिन्न प्रकार के खाद्य पदार्थों में क्या होता है ?|भोजन हमारे शरीर में क्या कार्य करता है ?|कार्बोहाइड्रैट |कार्बोहाइड्रैट की उपस्थिति का परीक्षण |सारांश
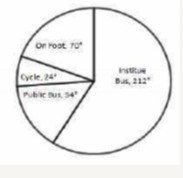
View SolutionStudy the pie-chart and answer the questions. In an institute, there are 900 students who use different modes of transport for to and from travel. The given pie diagram represents the requisite data.
पाई-चार्ट का अध्ययन करें और प्रश्नों के उत्तर दें। एक संस्थान में, 900 छात्र हैं जो आने-जाने के लिए परिवहन के विभिन्न साधनों का उपयोग करते हैं। दिए गए पाई चार्ट में संबंधित आंकड़े दिए गए हैं। The number of students who travel on foot is:
पैदल यात्रा करने वाले छात्रों की संख्या है:
View SolutionThe given pie chart shows the percentage distribution of 450 employees in an organization. Study the pie chart and answer the questions that follow
दिए गए पाई चार्ट एक संगठन में 450 कर्मचारियों के प्रतिशत को दर्शाता है। पाई चार्ट का अध्ययन करें और आने वाले प्रश्नों का उत्तर दें।
What is the central angle of the sector representing the number of employees in department A?
विभाग A में कर्मचारियों की संख्या का प्रतिनिधित्व करने वाले क्षेत्र का केंद्रीय कोण क्या है?
View Solutionपरिचय #!#विभिन्न प्रकार के खाद्य पदार्थ
View Solutionविभिन्न खाद्य पदार्थों के श्रोत
View Solution
