The following pie diagram shows the revenue of the company ABC, which manufactures the leather products . The total revnue of the company for the year 2015 was Rs. 3,628,000
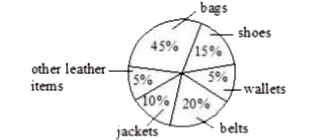
How much revenue was made with the sale of bags & shoes in 2015 ?
Rs. 27210
Rs. 1088400
Rs. 544200
Rs. 2176800
The correct Answer is:D
Step by step video, text & image solution for The following pie diagram shows the revenue of the company ABC, which manufactures the leather products . The total revnue of the company for the year 2015 was Rs. 3,628,000 How much revenue was made with the sale of bags & shoes in 2015 ? by Maths experts to help you in doubts & scoring excellent marks in Class 14 exams.
Updated on:21/07/2023Similar Questions
The following pie chart shows information on sales of a toy making company "XYZ" during 2017-18 financial year
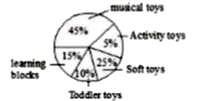
The total revenue made by sales of the toys was 38,72,000/-, How much revenue did the musical toys make?
View SolutionThe following pie diagram shows information on the sales of different types of food items by restaurant "XYZ".
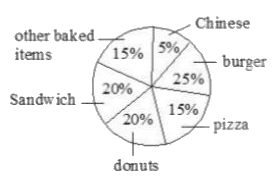
The total revenue made by the restaurant in NOV 2017 was 35 lakhs.
How much revenue was made by the restaurant "XYZ" through the sales of Chinese food items?
View Solution
Knowledge Check
The following pie diagrams shows the revenue of the company ABC, which manufactures the leather products. The total revenue of the company for the year 2015 Was Rs. 36,28,000.
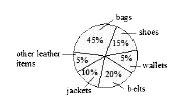
How much revenue was made on the sales of wallets & belts ?ARs. 9,07,000BRs. 1,81,400CRs. 90,700DRs. 1,814,000The following pie diagram shows information on the sales of different types of food items by restaurant XYZ.
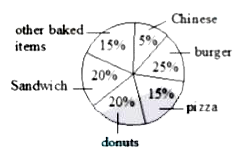
The total revenue made by the restaurant in Nov 2017 was 35 lakh.
How much revenue was made by the restaurant XYZ on the sale of all other baked items in Nov 2017?A5.25lakhB5 lakhC2 lakhD2.75 lakhThe given bar graph shows the sales revenue of steel company ‘ABC’ for the past four years.
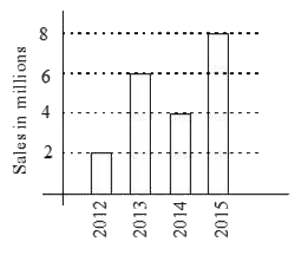
What was the total sales revenue in 2015 (in million $)?A2B4C8D6
The number of years I which the revenue of the company from the sale of product D is more than the average revenue from the sale of product A over six years, is:
View SolutionThe line chart given below shows the revenue of a company (in lac rupees) from year 2009 to 2016
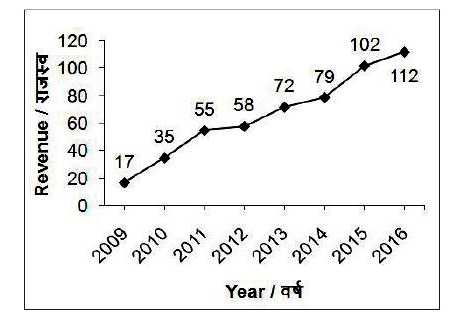
The average revenue of the company from 2013 to 2016 is how much percent more than the average revenue of the company from 2009 to 2012?
View SolutionThe line chart given below shows the revenue of a company (in lac rupees) from year 2009 to 2016.
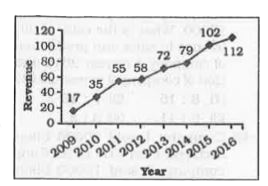
The averange revenue of the company from 2013 to 2016 is how much per cent more than the average revenue of the company from 2009 to 2012?
View SolutionThe given table represents the revenue (in ₹ crores) of a company from the sale of four products A,B,C and D in 6 years. Study the table carefully and answer the questions that follow.
दी गयी तालिका एक कंपनी को चार उत्पादों -A, B, C तथा D की बिक्री से 6 वर्षों में होने वाली आय ( करोड़ रुपये में ) को दर्शाती है | इस तालिका का ध्यानपूर्वक अध्ययन करें तथा फिर पूछे गए प्रश्नों का उत्तर दें The total revenue of the company from the sale of products B,C and D in 2014 is what percentage of
the total revenue from the sale of products C and D in 6 years?
2014 में उत्पाद B, C और D की बिक्री से कंपनी को हुई कुल आय 6 वर्षों में उत्पाद C और D की बिक्री से हुई कुल आय का कितना प्रतिशत है?
View SolutionThe bar chart given below shows the revenue (in Rs. crores) of company A for the years 2008 to 2015.
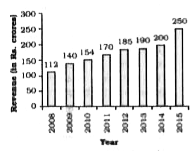
The revenue in 2015 is what per cent of the revenue in 2014?
View Solution
