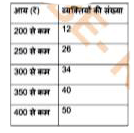
निम्नांकित तालिका का अध्ययन करें और उसके बाद दिए गए प्रश्न का उत्तर दें। तालिका 50 व्यक्तियों की दैनिक आय दर्शाती है।

₹200 से कम कमाने वाले व्यक्तियों की संख्या का, ₹300 या उससे अधिक कमाने वाले व्यक्तियों की संख्या से व्यक्तियों की संख्या से अनुपात ज्ञात करें।
6:5
3:4
3:10
6:10
The correct Answer is:B
Step by step video, text & image solution for निम्नांकित तालिका का अध्ययन करें और उसके बाद दिए गए प्रश्न का उत्तर दें। तालिका 50 व्यक्तियों की दैनिक आय दर्शाती है। ₹200 से कम कमाने वाले व्यक्तियों की संख्या का, ₹300 या उससे अधिक कमाने वाले व्यक्तियों की संख्या से व्यक्तियों की संख्या से अनुपात ज्ञात करें। by Maths experts to help you in doubts & scoring excellent marks in Class 14 exams.
Updated on:21/07/2023Similar Questions
The average age of fifteen persons is 32 years. If two more persons are added then the average is increased by 3 years. The new persons have an age difference of 11 years between them. The age (in years) of the younger among the new persons is:
पंद्रह व्यक्तियों की औसत उम्र 32 वर्ष है | यदि दो नए व्यक्तियों को शामिल किया जाये, तो औसत उम्र 3 वर्ष से बढ़ जाती है | नए व्यक्तियों की उम्र में 11 वर्ष का अंतराल है | नए व्यक्तियों में से छोटे व्यक्ति की उम्र ( वर्ष में ) ज्ञात करें |
View SolutionThe number of students studying A, B and C in a school are in the proportion 12 : 15 : 16. There is a proposal to increase the number of students studying A, B and C, respectively by 50%, 20% and 50%. What will be the new proportion of the number of students studying A, B and C?
किसी विद्यालय में A,B तथा C की पढ़ाई करने वाले छात्रों की संख्या का अनुपात 12 : 15 : 16 है | A, B तथा C पढ़ने वाले छात्रों की संख्या को क्रमशः 50%, 20% और 50% से बढ़ाने का प्रस्ताव है | A, B और C की पढ़ाई करने वाले छात्रों की संख्या का नया अनुपात क्या होगा ?
View SolutionTwo numbers A and B are, respectively, 80% and 20% more than a third number C. The ratio of the numbers A to B is:
दो संख्या A और B क्रमशः, 80% और 20% अधिक है एक तीसरी संख्या C से । A से B की संख्या का अनुपात है
View SolutionIn a school, 38 of the number of students are girls and the rest are boys, One -third of the number of boys are below 10 years and 23 of the number of girls are also below 10 years. If the number of students of age 10 Or more years is 260, then the number of boys in the school is:
किसी विद्यालय में छात्रों की संख्या का 38 भाग लड़कियाँ और शेष लड़के है| लड़को की संख्या का एक तिहाई 10 वर्ष से कम है और लड़कियों की संख्या का 23भी 10 वर्ष से कम है| यदि 10 वर्ष या उससे अधिक आयु वाले छात्रों की संख्या 260 है, तो विद्यालय में लड़को की संख्या ज्ञात कीजिए |
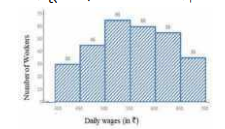
View SolutionStudy the graph and answer the question that follows.
आरेख का अध्ययन करें एवं इसके बाद पूछे गए प्रश्नों के उत्तर दें |
 What is the ratio of the total number of workers whose daily wages are less than Rs 500 to the total number of workers whose daily wages are Rs600 and above?
500 रुपये से कम दैनिक मजदूरी वाले श्रमिकों की कुल संख्या और 600 रुपये तथा अधिक की दैनिक मजदूरी वाले श्रमिकों की कुल संख्या में अनुपात ज्ञात करें |
View SolutionThe given table represents the number of engineers recruited by four companies A,B,C and D over the years. Study the table carefully and answer the questions that follows: The ratio of the total number of engineers recruited by companies A and B in 2015 and 2018 to the total number of engineers recruited by C and D in 2014 and 2018 is: दी गयी तालिका चार कंपनियों A, B, C और D के द्वारा इन वर्षों के दौरान भर्ती किये गए इंजीनियरों की संख्या दर्शाती है | इस तालिका का ध्यानपूर्वक अध्ययन करें तथा इसके बाद पूछे गए प्रश्न का उत्तर दें | कंपनी A और B के द्वारा 2015 और 2018 में भर्ती किये गए इंजीनियरों की कुल संख्या एवं C तथा D के द्वारा 2014 और 2018 में भर्ती किये गए इंजीनियरों की कुल संख्या के बीच अनुपात ज्ञात करें |
View SolutionThe given table represents the number of engineers recruited by four companies A,B,C and D over the years. Study the table carefully and answer the questions that follows: The number of years in which the number of engineers recruited by company D is less than the average number of engineers recruited by company B in the given six years, is: दी गयी तालिका चार कंपनियों A, B, C और D के द्वारा इन वर्षों के दौरान भर्ती किये गए इंजीनियरों की संख्या दर्शाती है | इस तालिका का ध्यानपूर्वक अध्ययन करें तथा इसके बाद पूछे गए प्रश्न का उत्तर दें | ऐसे कितने वर्ष हैं जिनमें कंपनी D के द्वारा भर्ती किये गए इंजीनियरों की संख्या दिए गए छः वर्षों की अवधि में कंपनी B के द्वारा भर्ती किये गए इंजीनियरों की औसत संख्या से कम है?
View SolutionThe given table represents the number of engineers recruited by four companies A,B,C and D over the years. Study the table carefully and answer the questions that follows:The total number of engineers recruited by company A in 2014 to 2017 is what percentage more than the total number of engineers recruited by all the four companies in 2019? दी गयी तालिका चार कंपनियों A, B, C और D के द्वारा इन वर्षों के दौरान भर्ती किये गए इंजीनियरों की संख्या दर्शाती है | इस तालिका का ध्यानपूर्वक अध्ययन करें तथा इसके बाद पूछे गए प्रश्न का उत्तर दें | कंपनी A के द्वारा 2014 से 2017 की अवधि में भर्ती किये गए इंजीनियरों की कुल संख्या सभी चार कंपनियों के द्वारा 2019 में भर्ती किये गए इंजीनियरों की कुल संख्या से कितना प्रतिशत अधिक है ?
View Solution
