दिसंबर महीने में, किसी कारखाने में खिलौनों का औसत दैनिक उत्पादन 512 है। यदि पहले 20 दिन के दौरान औसत उत्पादन 515 है और पिछले 13 दिन के दौरान औसत उत्पादन 510 है, तो 19 और 20 दिसंबर के उत्पादन का औसत कितना होगा?
512
529
513
1058
The correct Answer is:B
Step by step video, text & image solution for दिसंबर महीने में, किसी कारखाने में खिलौनों का औसत दैनिक उत्पादन 512 है। यदि पहले 20 दिन के दौरान औसत उत्पादन 515 है और पिछले 13 दिन के दौरान औसत उत्पादन 510 है, तो 19 और 20 दिसंबर के उत्पादन का औसत कितना होगा? by Maths experts to help you in doubts & scoring excellent marks in Class 14 exams.
Updated on:21/07/2023Similar Questions
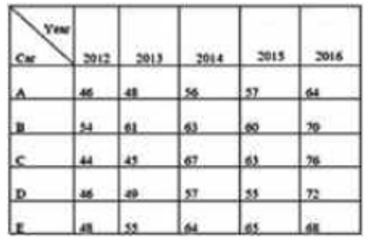
The table shows the production of different types of cars (in thousands).
यह तालिका एक कंपनी द्वारा अलग-अलग कारों के उत्पादन ( हज़ार में ) को दर्शाती है | The average production of type C cars during 2012 to 2016 is approximately what percent less than the total production of type D cars in 2012 and type E cars in 2014?
2012 से 2016 के दौरान C प्रकार की कारों का औसत उत्पादन 2012 में D प्रकार एवं 2014 में E प्रकार की कारों के कुल उत्पादन से लगभग कितना प्रतिशत कम है ?
View SolutionThe table shows the production of different types of cars (in thousands). यह तालिका एक कंपनी द्वारा अलग-अलग कारों के उत्पादन (हज़ार में ) को दर्शाती है | The average production of type A cars during the five years is what percent of the total production of type C cars during the five years? पांच वर्षों के दौरान A प्रकार की कारों का औसत उत्पादन पांच वर्षों के दौरान C प्रकार की कारों के कुल उत्पादन का कितना प्रतिशत है ?
View SolutionThe bar graph given below shows the wheat production (in tonnes) of a large farm during the year 2011-2018. In how many years was wheat production higher than the average production of the period? नीचे दिए गए दंड आरेख में वर्ष 2011-2018 के दौरान किसी बड़े फार्म के गेहूं उत्पादन (टन में) को दर्शाया गया है | अवधि के औसत उत्पादन की तुलना में दिए गए कितने वर्षो में गेहूं उत्पादन अधिक था ?
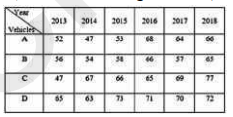
View SolutionThe table given below presents the figures of the production (in thousands) of different types of vehicles by a company during the year 2013-18.
नीचे दी गयी तालिका वर्ष 2013-18 के दौरान एक कंपनी के द्वारा विभिन्न प्रकार के वाहनों के उत्पादन ( हज़ार में)के आंकड़ों को प्रस्तुत करती है | In how many years is the production of type C vehicles, below the average production of type D vehicles over six years?
कितने वर्ष C प्रकार के वाहनों का उत्पादन इन छः वर्षों में D प्रकार के वाहनों के औसत उत्पादन से कम रहा है ?
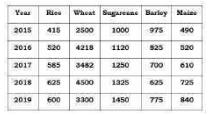
View SolutionIn the following table, the production of various crops (in tonnes) is given from 2015 to 2019. Study the table and answer the question that follows:
दी गयी तालिका में, 2015 से 2019 तक विभिन्न फसलों का उत्पादन (टन में ) दिया गया है | इस तालिका का अध्ययन करें तथा फिर पूछे गए प्रश्न का उत्तर दीजिए | The difference (in tonnes) between the average production of barley and average production of rice is:
जौ के औसत उत्पादन तथा चावल के औसत उत्पादन के बीच क्या अंतर (टन में ) है?
View SolutionThe following bar graph shows the data of the production of an item (in thousand tonnes) from four different companies A, B, C and D during the year mentioned.
निम्नलिखित दंड आरेख में उल्लिखित वर्षों के दौरान चार अलग-अलग कंपनियों A, B, C और D के द्वारा एक वस्तु (हजार टन में) के उत्पादन का आंकड़ा दिखाया गया है। In the five years given, the average production is highest in company _______ and lowest in company _______, respectively.
दिए गए पांच वर्षों में, औसत उत्पादन कंपनी______में सबसे अधिक है और कंपनी________ में सबसे कम है।
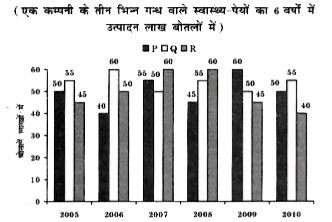
View SolutionWhat is the difference between the average production of flavour Q in 2008, 2009 and 2010 from that of flavour P in 2005, 2006 and 2007 in lakh bottles?
वर्ष 2008, 2009 तथा 2010 में गन्ध के औसत उत्पादन तथा वर्ष 2005, 2006 तथा 2007 में गन्ध P के औसत उत्पादन का अन्तर कितनी बोतलों का रहा है?

View SolutionOut of four numbers the average of the first three is 15 and that of the last three is 16. If the last number is 19, the first is. चार संख्याओं में से पहली तीन का औसत 15 है और अन्तिम तीन का औसत 16 है। यदि अन्तिम संख्या 19 है, तो पहली संख्या है
View Solution
