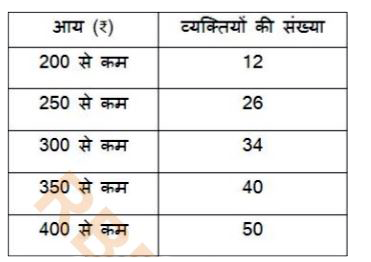
निम्नांकित तालिका का अध्ययन करें और उसके बाद दिए गए प्रश्न का उत्तर दें। दी गई तालिका 50 व्यक्तियों की दैनिक आय दर्शाती है।

कितने व्यक्ति प्रतिदिन Rs. 250 या उससे अधिक, लेकिन Rs. 350 से कम कमाते हैं?
A)24
B)14
C)28
D)18
The correct Answer is:B
Step by step video, text & image solution for निम्नांकित तालिका का अध्ययन करें और उसके बाद दिए गए प्रश्न का उत्तर दें। दी गई तालिका 50 व्यक्तियों की दैनिक आय दर्शाती है। कितने व्यक्ति प्रतिदिन Rs. 250 या उससे अधिक, लेकिन Rs. 350 से कम कमाते हैं? by Maths experts to help you in doubts & scoring excellent marks in Class 14 exams.
Updated on:21/07/2023Similar Questions
The inequation represented by the graph given below is :
View SolutionThe inequation that best describes the graph given below is _________
View SolutionThe inequation that best describes the following graph is _________
View SolutionWhich inequations represent the shaded region in the given figure
View SolutionMatch the followings (column I with column II)
ltimg src="https://d10lpgp6xz60nq.cloudfront.net/physics_images/NCERT_BIO_XI_C03_E01_011_Q01.png" width="80%"gt
View SolutionMatch column I with column II:
ltimg src="https://d10lpgp6xz60nq.cloudfront.net/physics_images/NCERT_BIO_XI_C18_E01_003_Q01.png" width="80%"gt
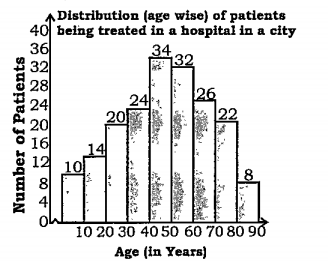
View SolutionStudy the given graph and answer the question that follows. The number of patients aged 10 or more years but below 40 years is what per cent less than the number of patients aged 50 or more years but below 80 years?

दिए गए ग्राफ का अध्ययन करें और नीचे दिए गए प्रश्न का उत्तर दें । 10 या उससे अधिक वर्ष लेकिन 40 वर्ष से कम आयु वालें मरीजों की संख्या, 50 वर्ष या उससे अधिक लेकिन 80 वर्ष से कम आयु वाले मरीजों को संख्या से कितने प्रतिशत कम हैं?
View SolutionThe given table represents the number of engineers recruited by four companies A,B,C and D over the years. Study the table carefully and answer the questions that follows: The number of years in which the number of engineers recruited by company D is less than the average number of engineers recruited by company B in the given six years, is: दी गयी तालिका चार कंपनियों A, B, C और D के द्वारा इन वर्षों के दौरान भर्ती किये गए इंजीनियरों की संख्या दर्शाती है | इस तालिका का ध्यानपूर्वक अध्ययन करें तथा इसके बाद पूछे गए प्रश्न का उत्तर दें | ऐसे कितने वर्ष हैं जिनमें कंपनी D के द्वारा भर्ती किये गए इंजीनियरों की संख्या दिए गए छः वर्षों की अवधि में कंपनी B के द्वारा भर्ती किये गए इंजीनियरों की औसत संख्या से कम है?
View Solution
