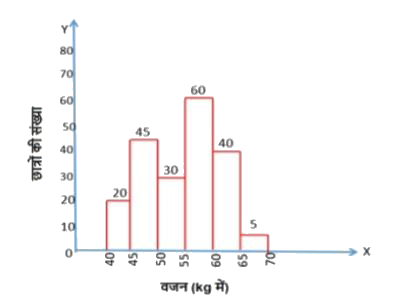
आयतचित्र किसी विद्यालय में कक्षा X के छात्रों के वजन को दर्शाता है।
माना कि 50 kg से कम वजन वाले छात्रों की संख्या X है, और 60 kg या इससे अधिक वजन वाले छात्रों की संख्या yहै। x : y का मान ज्ञात करें।

11:13
9:13
13:9
13:11
The correct Answer is:C
Step by step video, text & image solution for आयतचित्र किसी विद्यालय में कक्षा X के छात्रों के वजन को दर्शाता है। माना कि 50 kg से कम वजन वाले छात्रों की संख्या X है, और 60 kg या इससे अधिक वजन वाले छात्रों की संख्या yहै। x : y का मान ज्ञात करें। by Maths experts to help you in doubts & scoring excellent marks in Class 14 exams.
Updated on:21/07/2023Similar Questions
The number of students studying A, B and C in a school are in the proportion 12 : 15 : 16. There is a proposal to increase the number of students studying A, B and C, respectively by 50%, 20% and 50%. What will be the new proportion of the number of students studying A, B and C?
किसी विद्यालय में A,B तथा C की पढ़ाई करने वाले छात्रों की संख्या का अनुपात 12 : 15 : 16 है | A, B तथा C पढ़ने वाले छात्रों की संख्या को क्रमशः 50%, 20% और 50% से बढ़ाने का प्रस्ताव है | A, B और C की पढ़ाई करने वाले छात्रों की संख्या का नया अनुपात क्या होगा ?
View SolutionIn a school, 38 of the number of students are girls and the rest are boys, One -third of the number of boys are below 10 years and 23 of the number of girls are also below 10 years. If the number of students of age 10 Or more years is 260, then the number of boys in the school is:
किसी विद्यालय में छात्रों की संख्या का 38 भाग लड़कियाँ और शेष लड़के है| लड़को की संख्या का एक तिहाई 10 वर्ष से कम है और लड़कियों की संख्या का 23भी 10 वर्ष से कम है| यदि 10 वर्ष या उससे अधिक आयु वाले छात्रों की संख्या 260 है, तो विद्यालय में लड़को की संख्या ज्ञात कीजिए |
View SolutionThe sum of weight of A and B is 80kg, 50% of A’s weight is 56 times the weight of B. Find the difference between their weights.
A और B के वजन का योग 80 kg है, A के वजन का 50% B के वजन का 56 गुना है। उनके वजन के बीच का अंतर ज्ञात करें।
View SolutionThe given graph shows the marks obtained by students in an examination.
दिया गया आरेख किसी परीक्षा में छात्रों के प्राप्तांक दर्शाता है | The number of students who obtained less than 300 marks is what percent more than the number of students who obtained 350 or more marks?
300 अंक से कम प्राप्त करने वाले छात्रों की संख्या 350 या इससे अधिक अंक प्राप्त करने वाले छात्रों की संख्या से कितना प्रतिशत अधिक है ?
View SolutionThis table shows the number of students studying in various streams in different colleges. निम्नलिखित तालिका पांच कॉलेजों के तीन विषयों में पढ़ने वाले छात्रों की संख्या दर्शाती है | The number of students in the science stream of college C is approximately what percentage of students studying in that college? कॉलेज C में विज्ञान विषय में छात्रों की संख्या उस कॉलेज में पढ़ने वाले छात्रों की संख्या का लगभग कितना प्रतिशत है ?
View SolutionThe given bar graph presents the number of students from Science and Arts streams from a school in different years. दिया गया दंड आरेख अलग-अलग वर्षों में एक विद्यालय में विज्ञान एवं कला संकाय के छात्रों की संख्या को दर्शाता है | What is the ratio of the total number of Science students in 2011 and 2015 to that of Arts in 2012 and 2015? 2011 तथा 2015 में विज्ञान के छात्रों की कुल संख्या का 2012 तथा 2015 में कला के छात्रों की कुल संख्या के साथ अनुपात ज्ञात करें |
View SolutionThe given Bar Graph presents the number of students of two schools for six years. दिया गया दंड आरेख छः वर्ष की अवधि में दो विद्यालयों में छात्रों की संख्या को दर्शाता है | What is the ratio of the number of students taken for all years together from school A to that from school B? सभी वर्षों को मिलाकर विद्यालय A और विद्यालय B के छात्रों की संख्या में अनुपात ज्ञात करें |
View SolutionThe given Bar Graph presents the number of students of two schools for six years. दिया गया दंड आरेख छः वर्ष की अवधि में दो विद्यालयों में छात्रों की संख्या को दर्शाता है | What is the ratio of the number of students taken together for the years 2008, 2012 and 2013 in School A to the number of students taken together for the years 2008, 2012 and 2013 in school B? विद्यालय A में 2008, 2012 तथा 2013 को मिलाकर छात्रों की संख्या का विद्यालय B में 2008, 2012 तथा 2013 को मिलाकर होने वाले छात्रों की संख्या के साथ अनुपात ज्ञात करें |
View Solution
