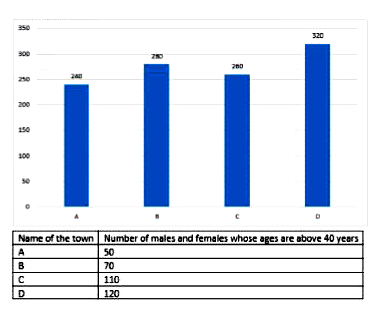
The bar graph shows the total number of male and female lives in four different towns and table shows the number of males and females whose ages are above 40 years. Read the data carefully and answer the questions below:
Ratio of age A after two years to the present age of B is 5: 6 and ratio of age of A 8 years hence to the age of B 6 year hence is 6: 7. Find B’s present age.
30
34
36
28
The correct Answer is:C
Let the age of A be x years and age of B be y years,
A.T.Q,
6A+12=5B
6A-5B=-12 …….(i)
7A + 56 = 6B + 36
7A – 6B = - 20 ----------- (ii)
On solving eq. (i) and (ii), we get
A = 28 and B = 36
Similar Questions
Knowledge Check
The bar graph shows the total number of male and female lives in four different towns and table shows the number of males and females whose ages are above 40 years. Read the data carefully and answer the questions below:
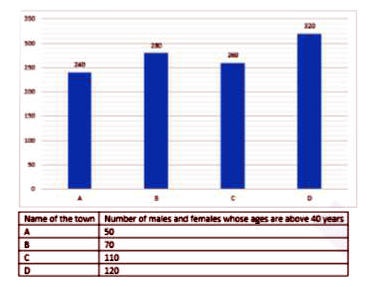
Find the average number of those males and females whose ages are below and equals to 40 years of town A, C and D.A180B160C190D200The bar graph shows the total number of male and female lives in four different towns and table shows the number of males and females whose ages are above 40 years. Read the data carefully and answer the questions below:
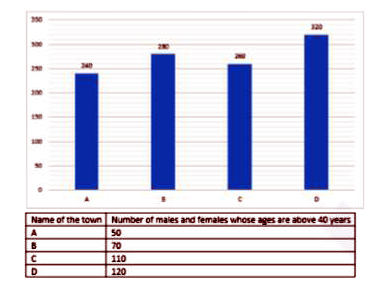
Find the ratio of the those number of males and females whose ages are above 40 years in town A and B to those males and females whose ages are below and equals to 40 years in town D.A1:1B3:5C2:5D4:7The bar graph shows the total number of male and female lives in four different towns and table shows the number of males and females whose ages are above 40 years. Read the data carefully and answer the questions below:
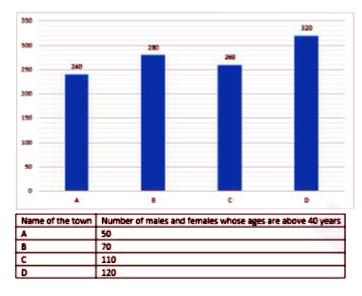
Number of males and females in town A whose ages are below and equals to 40 years is what percent less than those number of males and females in town D whose ages are below and equals to 40 years.A10%B12%C7%D5%
Before 4 years the ratio between the age of A and B was 3:4. After 7 years the total of their ages will be 71 years. Find their present age?
View SolutionThe bar graph shows the total number of male and female lives in four different towns and table shows the number of males and females whose ages are above 40 years. Read the data carefully and answer the questions below:
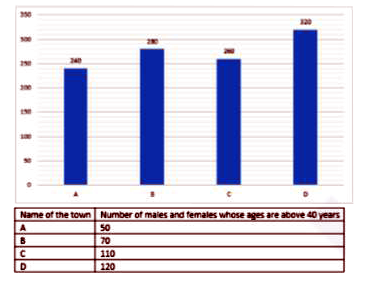
If 40% of population in town B whose ages are below and equals to 40 years are male and 40% of population in town D whose ages are below and equals to 40 years are female. Find the difference between the females of town B and D whose ages are below and equals to 40 years.
View SolutionThe bar graph shows the total number of male and female lives in four different towns and table shows the number of males and females whose ages are above 40 years. Read the data carefully and answer the questions below:
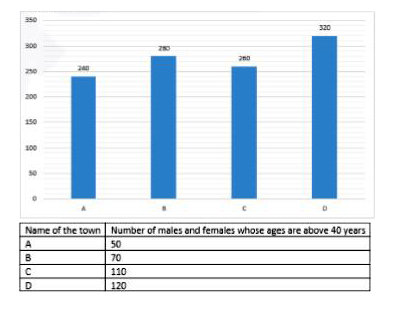
If in another town E, total males and females are 10% more than the total males and females in town A and those males and females whose ages are above 40 years is 20% more than those males and females whose ages are above 40 years in town C. find the number of those males and females in town E whose ages are below and equals to 40 years.
View SolutionPresent age of A is 3 years less than present age B.Ratio of B's age 5 year ago A's age 4 year hence is 5:8 then find present age(in years) of A.
View Solution4 years ago, the ratio of ages of A and B was 9 : 11 and 6 years hence, the ratio of ages of A and B will be 7 : 8. Find the present age of B.
View Solution
