The enrolment in a school during six consecutive years was as follows: 1555, 1670, 1750, 2013, 2540, 2820 Find the mean enrolment of the school for this period
2058
1058
2032
1120
The correct Answer is:A
Step by step video, text & image solution for The enrolment in a school during six consecutive years was as follows: 1555, 1670, 1750, 2013, 2540, 2820 Find the mean enrolment of the school for this period by Maths experts to help you in doubts & scoring excellent marks in Class 14 exams.
Updated on:21/07/2023Topper's Solved these Questions
- DATA HANDLING BOOK - ARIHANT PUBLICATION PUNJABCHAPTER - DATA HANDLING EXERCISE - CHAPTER EXERCISE
50 Videos
- ALGEBRA BOOK - ARIHANT PUBLICATION PUNJABCHAPTER - ALGEBRA EXERCISE - CHAPTER EXERCISE
73 Videos
- DATA HANDLING AND PATTERNSBOOK - ARIHANT PUBLICATION PUNJABCHAPTER - DATA HANDLING AND PATTERNSEXERCISE - Chapter Exercise
50 Videos
Similar Questions
The given bar graph represents the number of students admitted in four schools (SI, S2, S3, S4) during two consecutive vears 2017 and 2018.
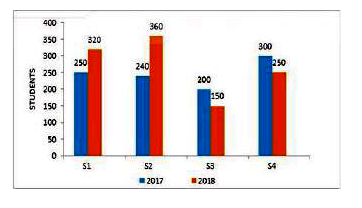
The total number of students admitted in school S1 for both years is approximately what percent of total student admitted in school S2 for both years?
View SolutionThe given bar graph represents the pass percentage of 10th and 12th classes of a school during the consecutive four year period 2016-2019.
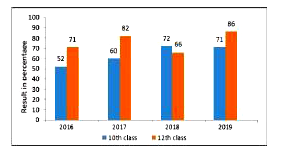
What is the average percentage of the failed students of the 12th class for all four years?
View Solution
Knowledge Check
What is the average number of students from school B during the six year period
A656.7B616.67C664.37D660.17Study the following graph carefully and answer the questions given below. The number of students who joined and left the school in the beginning of year for six years
from 2003 to 2008
Initial Strength of the school is 2000
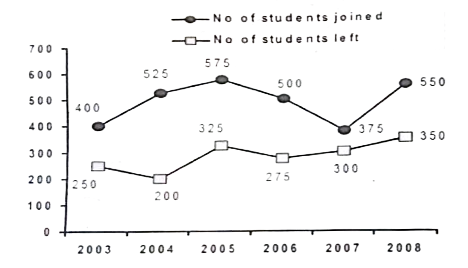
For which of the following year, the percentage rise/fall in the number of students left from the previous year is the hightest?A2003B2004C2006D2005The given bar graph represents the number of students admitted in four schools (S1, S2, S3, S4) during two consecutive years 2017 and 2018.
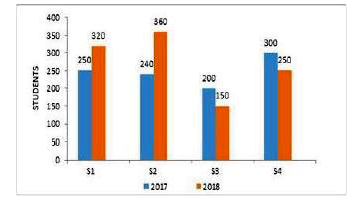
What is the average number of students admitted to all schools in 2018?A280B275C290D270
The given bar graph represents the pass percentage of the 10th and 12th classes of a school during the consecutive four year period 2016-2019.
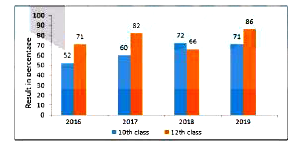
What is the average of pass percentage of the 10th class for all four years?
View SolutionThere were 2075 members enrolled in the club during last year.This year enrolment is decreased by 4% a) Find the decrease in enrolment b) How many members are enrolled during this year?
View SolutionStudy the following graph carefully and answer the questions given below. The number of students who joined and left the school in the beginning of year for six years
from 2003 to 2008
Initial Strength of the school is 2000
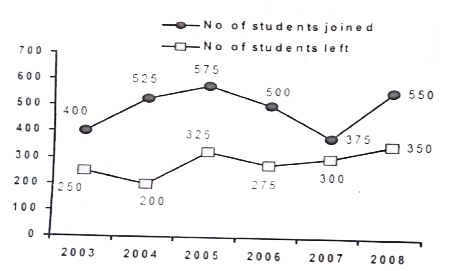
During which of the following pairs of years, the strength of the school is equal?
View SolutionStudy the following graph carefully and answer the questions given below. The number of students who joined and left the school in the beginning of year for six years
from 2003 to 2008
Initial Strength of the school is 2000
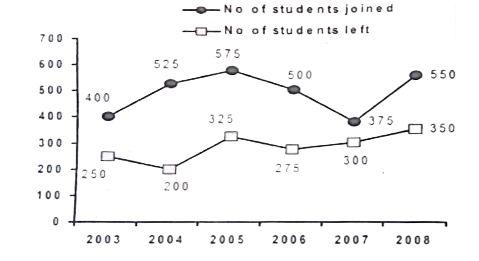
What was the increase in strength of the school from 2004 to 2005?
View SolutionStudy the following graph carefully and answer the questions given below. The number of students who joined and left the school in the beginning of year for six years from 2003 to 2008. (Initial Strength of the school is 2000)
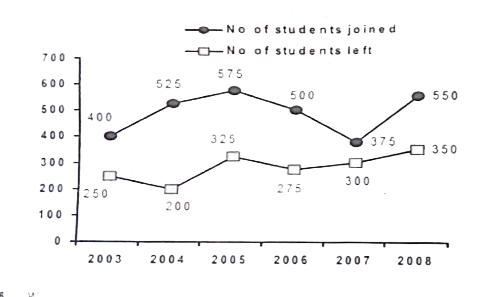
The number of students in 2006 is approximately what percent of the number of student in 2004 ?
View Solution
