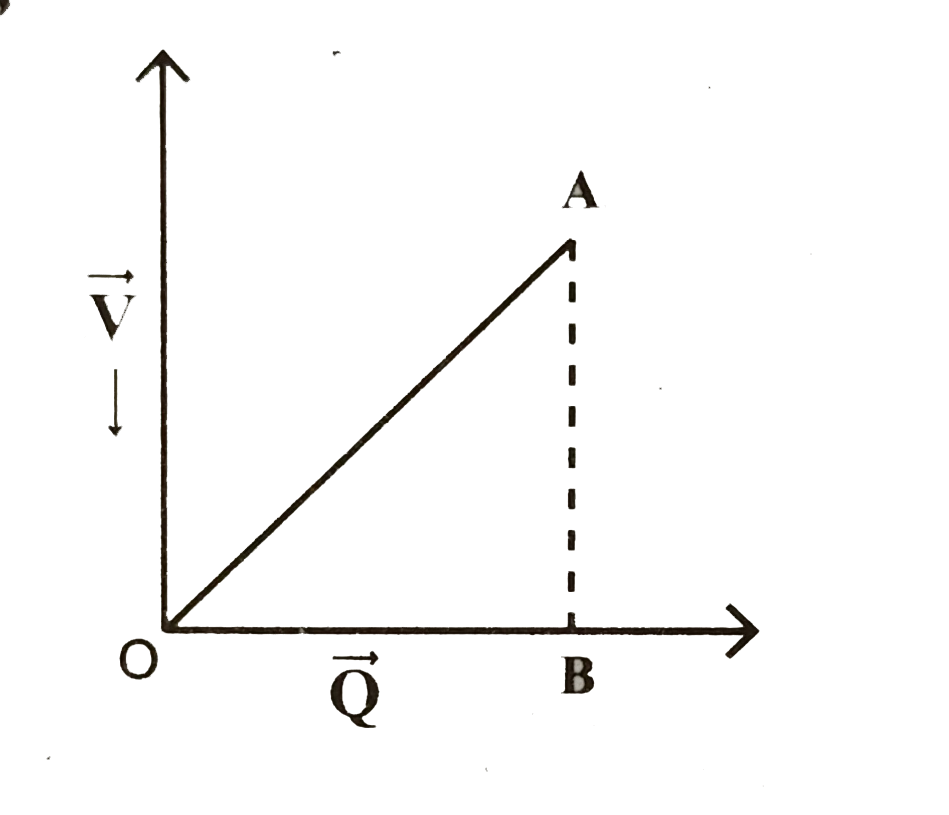
Charge Q on a capacitor varies with voltage V as shown in graph, where Q is along X-axis and V along Y-axis. The area of triangle OAB represents ?
 Solution in Tamil
capacitance
capacitive reactane
magnetic field betwee the plates
energy stored in the capacitor
The correct Answer is:D
Step by step video & text solution for Charge Q on a capacitor varies with voltage V as shown in graph, where Q is along X-axis and V along Y-axis. The area of triangle OAB represents ? by Physics experts to help you in doubts & scoring excellent marks in Class 12 exams.
Updated on:21/07/2023Similar Questions
चित्र में प्रदर्शित X - Y अक्ष के केन्द्र पर एक आवेश +q रखा गया है | सीधी रेखा AB के अनुदिश , आवेश Q को A से B तक ले जाने में किया गया कार्य होगा

View SolutionThe line x + y = p, x and y axis meet at A and B respectively. A triangle APQ that is right-angled at Q is under the triangle OAB, where 0 is the origin. P and Q are located at OB and AB respectively. If the area of triangle APQ is 3/8 of the area of triangle OAB, then (AQ)/(BQ) Is equal -
View SolutionCharge Q on a capacitor varies with voltage V as shown in the figure, where Q is taken along the X-axis and V along the Y-axis. The area of triangle OAB represents

View SolutionElectric current is the flow of charges along a defi nite direction and take place through metals as well as semiconductors.Give the sketch of graph with V along X-axis and I along Y-axis for a metal at room temperature.
View SolutionTwo point charge +-q are placed on the axis at x= -a and x= +a , as shown in fig. (i) Plot the variation of E along the x-axis. (ii) Plot the variation of E along the y-axis.
View SolutionRepresenting the stopping potential V along y-axis and (1λ) along x-axis for a given photocathode, the curve is a straight line, the slope of which is equal to
View Solutiony = -a और y =+a पर दो समरूप धनात्मक आवेशों को y- अक्ष पर रखा गया है। x-अक्ष के अनुदिश V (विभव) के परिवर्तन को आलेख द्वारा दिखाया गया है:
View SolutionThe velocity v of a particle moving along x - axis varies with ist position (x) as v=α√x, where α is a constant. Which of the following graph represents the variation of its acceleration (a) with time (t)?
View Solution
