The pie chart given below shows sale of different types of cars in a city for a given year. The total sale of cars in the city is 6,00,000.
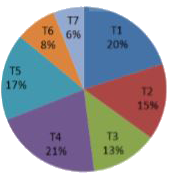
What is the difference in the number of cars sold of type T5 and T1?
21000
24000
18000
27000
The correct Answer is:C
Step by step video, text & image solution for The pie chart given below shows sale of different types of cars in a city for a given year. The total sale of cars in the city is 6,00,000. What is the difference in the number of cars sold of type T5 and T1? by Maths experts to help you in doubts & scoring excellent marks in Class 14 exams.
Updated on:21/07/2023Similar Questions
The given bar graph represents the sale of cars in five different states in a month.
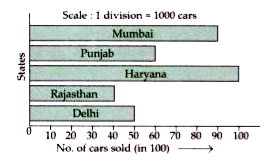 What is the difference between the numbre of cars sold in Mumbai and Punjab ?
View SolutionThe pie chart given below shows the percentage of time taken by different processes in making a car
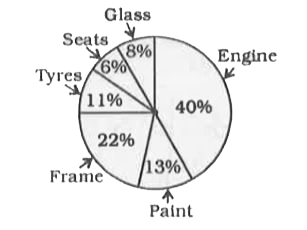
If total time taken in engine and tyres is 127 . 5 hours , what is time difference (in hours) in time taken by frame and glass respectively ?
View Solution
Knowledge Check
The pie chart given below shows sale of different types of cars in a city for a given year. The total sale of cars in the city is 600000.
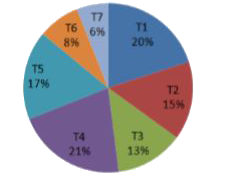
What is the sum of total number of cars sold of type T5, T6 and T3?A232000B228000C245000D252000The pie chart given below shows sale of different types of cars in a city for a given year. The total sale of cars in the city is 600000.
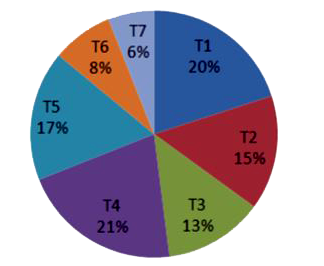
How many T4 cars are sold in the city for the given year?A144000B138000C126000D128000If number of cars sold of model C are 22000, then what will be the difference in the number of cars sold of model A and B?
A800B1200C1000D1500
The given pie-chart shows the distribution (in degrees) of cars sold of difference models by a company in 2015-16.
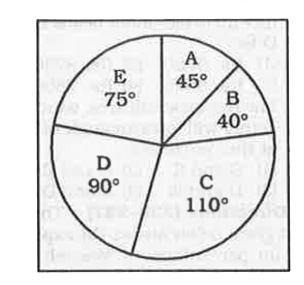
If number of cars sold of model C are 22000, then what will be the difference in the number of cars sold of models A and B ?
View SolutionThe given pie-chart shows the distribution (in degrees) of cars sold of difference models by a company in 2015-16.
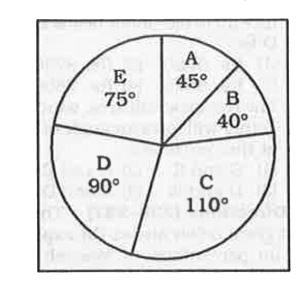
If the number of cars sold of model D is 40500, what is the ratio between the number of cars sold of models D and E ?
View SolutionThe bar chart given below shows the number of cars sold by brand A and B for the year for 2008 to 2016
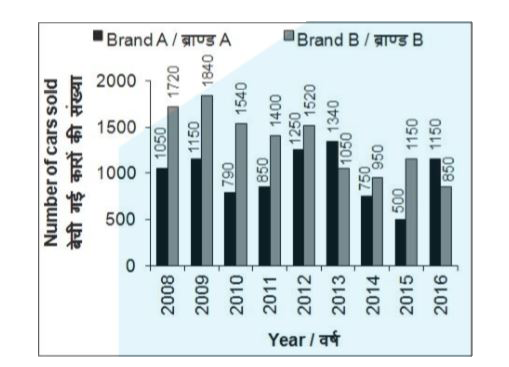
What is the percentage decrease in the number of car sold in year 2015 from year 2014 for brand A?
View SolutionThe table shows the production of different types of cars by a company (in thousands) in 5 years.

The total production of type B cars in all the five years is what percent more than the total production of type A. B and D cars in 2017?
View SolutionThe bar chart given below shows the number of cars sold by brand A and B for the year for 2008 to 2016
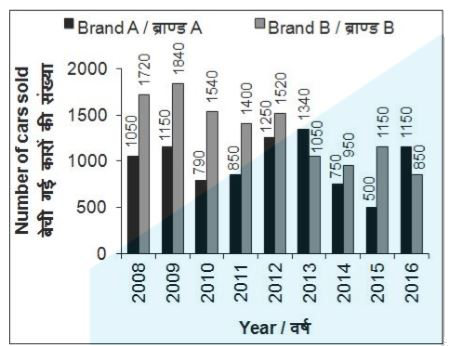
In how many years, the number of cars sold by brand A is more than the number of cars sold by brand B?
View Solution