The pie chart given below shows the annual snowfall received by 7 states of a country. The snowfall is shown as a percentage of total annual snowfall of the country.
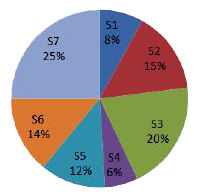
If the annual snowfall received by the country is 700 cm, then what is the monthly snowfall received by S5?
7 cm
5 cm
21 cm
12 cm
The correct Answer is:A
Step by step video, text & image solution for The pie chart given below shows the annual snowfall received by 7 states of a country. The snowfall is shown as a percentage of total annual snowfall of the country. If the annual snowfall received by the country is 700 cm, then what is the monthly snowfall received by S5? by Maths experts to help you in doubts & scoring excellent marks in Class 14 exams.
Updated on:21/07/2023Similar Questions
Given pie chart shows the expenditure of a country If the total expenditure of thecountry is Rs 180 crores, then what is the expenditure on agriculture ?Security
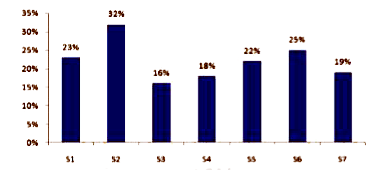
View SolutionThe bar chart given below shows the amount of sugar used in making 7 different varieties of sweets S1, S2, S3, S4, S5, S6 and S7 has been show as a percentage of total weight of the sweet.
The total weight of sweet S4 is 150 kg. What is the amount of sugar used in sweet S4
?
View Solution
Knowledge Check
The pie chart given below shows the annual snowfall received by 7 states of a country. The snowfall is shown as a percentage of total annual snowfall of the country.
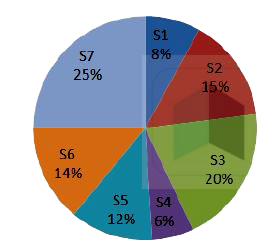
If the annual snowfall received by the country is 700 cm. What is the difference in the annual snowfalls of S3 and S2?AA) 42cmBB) 7cmCC) cannot be determinedDD) 35 cmThe pie chart given below shows the imports of 7 different items P1, P2, P3, P4, PS, P6 and P7 as a percentage of total imports of a country.
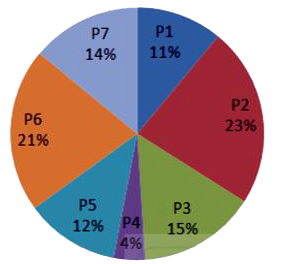
If the total import of item P1 is ₹ 33000, then what is the value of imports of item P2?A46000B57500C80500D69000The pie chart given below shows the imports of 7 different items P1, P2, P3, P4, PS, P6 and P7 as a percentage of total imports of a country.
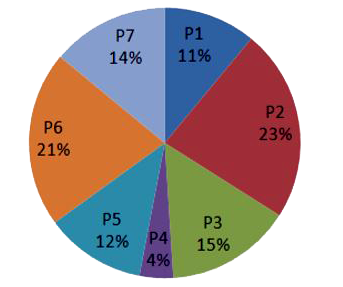
Imports of item P6 is how much percent more than the imports of item P5?A75%B33%C80%D9%
The pie chart given below shows the number of tigers in different zoos. The number of tigers in a particular zoo are shown as a percentage of total number of tiger in all the zoos together.
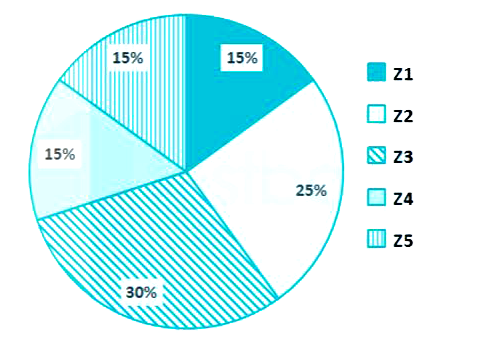
What is the difference in central angle of the sectors for Z1 and Z3?
View SolutionThe pie chart given below shows the number of female students in different subjects. The number of female students in a particular subject are shown as a percentage of total number of female students in all the subjects together.
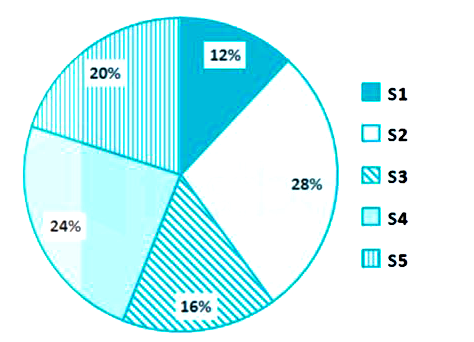
If the total number of female students are 3600, then what is the difference in number of female students in subjects S1 and S4?
View SolutionThe pie chart shows the value of the total annual production of dry fruits of a country. Study the diagram and answer the following questions.
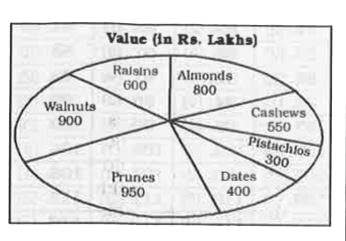
What is the total value (in Rs. lakhs) of the annual dry fruit production of the country?
View SolutionThe pie chart shows the value of the total annual production of dry fruits of a country. Study the diagram and answer the following questions.

What is the total value (in Rs. lakhs) of the annual dry fruit production of the country?
View SolutionThe pie-chart given below shows the percentage distribution of annual expenditure on various items of a company. The annual expenditure of the company is Rs. 72 crores.
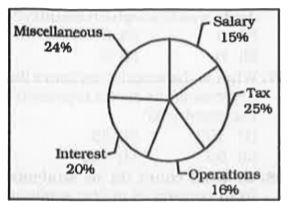
What is the monthly expenditure (in Rs. crores) on Miscellaneous by the company?
View Solution
