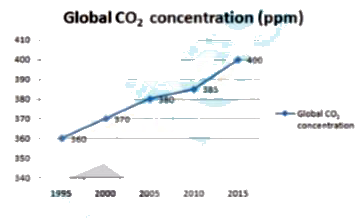
Based on the given graph, which statement correctly describes the pattern?
(a)There is increase in CO2 concentration over the years
(b)There is decrease in CO2 concentration over the years
(c)There is no change in CO2 concentration over the years
(d)The CO2 concentration fluctuates over these years
A
There is increase in CO2 concentration over the years
B
There is decrease in CO2 concentration over the years
C
There is no change in CO2 concentration over the years
D
The CO2 concentration fluctuates over these years
Video Solution
Text Solution
The correct Answer is:A
|
Answer
Step by step video, text & image solution for Based on the given graph, which statement correctly describes the pattern? (a)There is increase in CO_(2) concentration over the years (b)There is decrease in CO_(2) concentration over the years (c)There is no change in CO_(2) concentration over the years (d)The CO_(2) concentration fluctuates over these years by Maths experts to help you in doubts & scoring excellent marks in Class 14 exams.
Updated on:21/07/2023Similar Questions
Knowledge Check
CO2 concentration is
AMore in expired air than in alveolar airBMore in alveolar air than in expired airCMore in inspired air than in alveolar airDMore in inspired air than in expired airwhat is true for CO2 concentration ?
Amore in alveolar air than in atmospheric airBmore in atmospheric air than in alveolar airCmore in atmospheric air thant in deoxgenated bloodDmore in atmospheric air than in deoxgenated bloodAn increase in CO2 concentration in atmosphere will result in:
AAdverse effects of natural vegatationBGlobal warmingCTemperature decrease in global atmosphereDGenetic disorders in plants and animals
