The following table shows the daily earnings of 45 skilled workers: How many workers earn less than ₹ 1,100 in a day?
निम्नलिखित तालिका 45 कुशल
श्रमिकों की दैनिक आय को दर्शाती है |

कितने श्रमिक एक दिन में 1,100 रुपये से कम कमाते हैं ?
29
10
39
43
The correct Answer is:C
Step by step video, text & image solution for The following table shows the daily earnings of 45 skilled workers: How many workers earn less than ₹ 1,100 in a day? निम्नलिखित तालिका 45 कुशल श्रमिकों की दैनिक आय को दर्शाती है | कितने श्रमिक एक दिन में 1,100 रुपये से कम कमाते हैं ? by Maths experts to help you in doubts & scoring excellent marks in Class 14 exams.
Updated on:21/07/2023Similar Questions
The following table shows the income (in ₹) for a particular month, together with their source, in respect of 5 employees(A,B,C,D and E).
निम्नलिखित तालिका 5 कर्मचारियों (A, B, C, D तथा E ) के संबंध में एक विशेष माह की आय ( रुपये में ) तथा उसके स्रोत को दर्शाती है |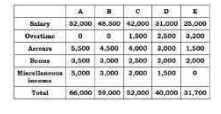 How many employees got more than a total of ₹ 10,000 as income other than salary?
कितने कर्मचारियों को वेतन के अतिरिक्त कुल 10,000 रुपये से अधिक की आय हुई है ?
View SolutionThe following table shows the income (in rupees) for a particular month, together with their source, in respect of 5 employees(A,B,C,D and E)
निम्नलिखित तालिका 5 कर्मचारियों (A, B, C, D तथा E) के संदर्भ में एक विशेष महीने की आय तथा उसके स्रोत को दर्शाती है | For employee D, the income from overtime is what percentage of his total income?
कर्मचारी D के लिए, ओवरटाइम से होने वाली आय उसकी कुल आय का कितना प्रतिशत है ?
View Solution
Knowledge Check
The following table shows the daily earnings of 45 skilled workers: How many workers earn less than ₹ 1,100 in a day?
निम्नलिखित तालिका 45 कुशल श्रमिकों की दैनिक आय को दर्शाती है |
कितने श्रमिक एक दिन में 1,100 रुपये से कम कमाते हैं ?A29B10C39D43
The following table shows the income (in rupees) for a particular month, together with their source, in respect of 5 employees(A,B,C,D and E).
निम्नलिखित तालिका 5 कर्मचारियों ( A.B, C, D तथा E) के संबंध में एक विशेष माह की आय तथा उसके स्रोत को दर्शाती है।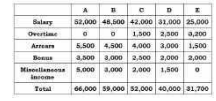 How many employees got more arrears than the average arrears received by all the employees?
कितने. कर्मचारियों को. सभी कर्मचारियों को मिलने वाले औसत बकाया से अधिक बकाया राशि मिली है ?
View SolutionThe following table shows the items of expenditure of a company (in ₹ lakh per annum), from 2015 to 2019.
निम्नलिखित तालिका 2015-2019 तक एक कंपनी के व्यय की मदों को ( लाख रुपये प्रति वर्ष में ) दर्शाती है | What is the average amount of interest per year which the company had to pay during this
period?
इस अवधि के दौरान प्रति वर्ष कंपनी को ब्याज की कितनी औसत राशि का भुगतान करना पड़ा है ?
View SolutionThe following table shows the number of students enrolled in different faculties in a college.
निम्नलिखित तालिका एक कॉलेज में अलग-अलग विषयों में नामांकित छात्रों की संख्या को दर्शाती है | The percentage of students studying in faculties other than Science is:
विज्ञान के अतिरिक्त अन्य विषयों की पढ़ाई करने वाले छात्रों का प्रतिशत है
View SolutionThe following table shows the number of students of 7 college participating in extra curricular activities:
निम्न सारणी उन कॉलेजों के छात्रों की संख्या दर्शाती है, जो पाठ्येत्तर क्रियाकलापों में भाग लेते हैं।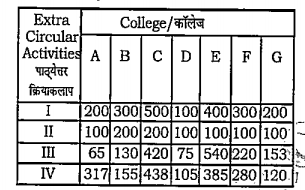 Read the table and answer the following question.
तालिका पढ़ें और निम्नलिखित प्रश्नों के उत्तर दें।
The median of the data of students in activity III is-
क्रियाकलाप III से संबंधित आँकड़ों को माध्यिका है-
View SolutionStudy the graph and answer the question that follows.
आरेख का अध्ययन करें एवं इसके बाद पूछे गए प्रश्नों के उत्तर दें |
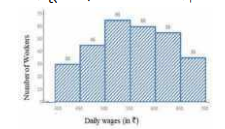 What is the ratio of the total number of workers whose daily wages are less than Rs 500 to the total number of workers whose daily wages are Rs600 and above?
500 रुपये से कम दैनिक मजदूरी वाले श्रमिकों की कुल संख्या और 600 रुपये तथा अधिक की दैनिक मजदूरी वाले श्रमिकों की कुल संख्या में अनुपात ज्ञात करें |
View SolutionThe following table showing the percentage of the total population of a state in different age groups. Out of every 50,000 people, find the approximate number of persons below the age of 35?
निम्नलिखित तालिका एक राज्य में अलग-अलग आयु वर्ग की कुल आबादी के प्रतिशत को दर्शाती है |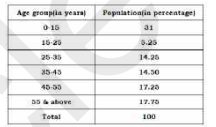
प्रत्येक 50,000 लोगों में से, 35 वर्ष से कम उम्र के लोगों की संख्या (लगभग) ज्ञात करें |
View SolutionThe following histogram shows the weight of the students of class X in a school on a particular day. Total number of students enrolled in the class X = 200.
निम्नलिखित हिस्टोग्राम किसी एक दिन पर एक स्कूल में दसवीं कक्षा के छात्रों के वजन को दर्शाता है। कक्षा - 200 में नामांकित कुल छात्र।
The number of students weighing less than 55kg is what percentage less than the number of students weighing 55kg to 65kg?
55 किग्रा से कम वजन वाले छात्रों की संख्या 55 किग्रा से किग्रा तक वाले छात्रों की संख्या से कितने प्रतिशत काम है ज्ञात करे |
View Solution
