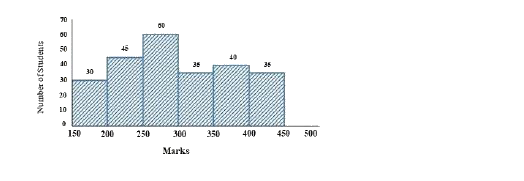
The given graph shows the marks obtained by students in an examination.
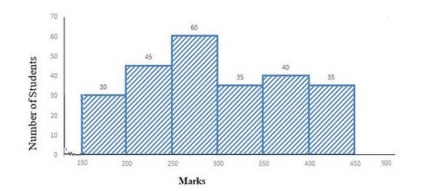 The number of students who obtained less than 300 marks is what percent more than the number of students who obtained 350 or more marks?
28%
44.4%
22.7%
80%
The correct Answer is:D
Step by step video & text solution for The given graph shows the marks obtained by students in an examination. The number of students who obtained less than 300 marks is what percent more than the number of students who obtained 350 or more marks? by Maths experts to help you in doubts & scoring excellent marks in Class 14 exams.
Updated on:21/07/2023Similar Questions
The given graph shows the weights of students in a school on a particular day.
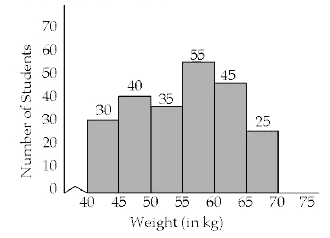
The number of students weighing less than 50kg is what percent less than the number of students weighing 55kg or more?
View SolutionThe given graph shows the marks obtained by students in an examination.
दिया गया आरेख किसी परीक्षा में छात्रों के प्राप्तांक दर्शाता है | The number of students who obtained less than 300 marks is what percent more than the number of students who obtained 350 or more marks?
300 अंक से कम प्राप्त करने वाले छात्रों की संख्या 350 या इससे अधिक अंक प्राप्त करने वाले छात्रों की संख्या से कितना प्रतिशत अधिक है ?
View Solution
Knowledge Check
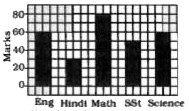
The above bar graph show the marks obtained by a students in an examination. What is the average marks obtained by the student ?A55B56C57D58Study the given histogram that shows the marks obtained by students in an examination and answer the question that follows .
The number of students who obtained less than 250 marks is :A135B75C30D45Study the given histogram that shows the marks obtained by students in examination and answer the question that follows
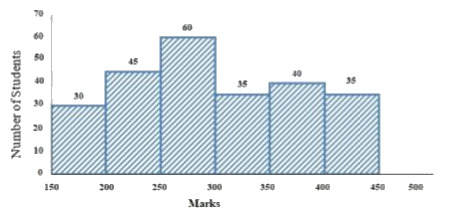
The number of students who obtained less than 200 marks is :AA)45BB)135CC)30DD)75
Study the given graph and answer the question that follows
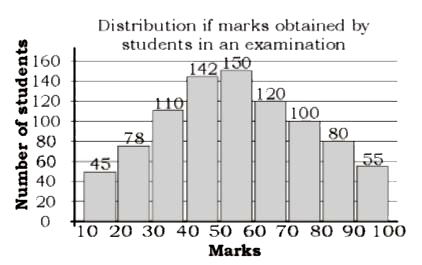
The total marks of students obtaining less than 50 marks is what percentage more than the total number of students obtaining 60 marks or more
View SolutionThe given bar graph shows the marks obtained by students in a Science test.
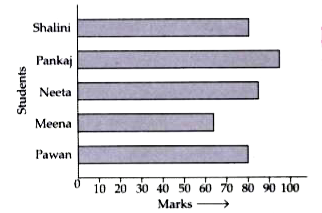
Who scored the highest marks in the test ? Whats in the score ?
View SolutionWhat are the average marks obtained by the student?
View SolutionStudy the given graph and answer the question that follows .
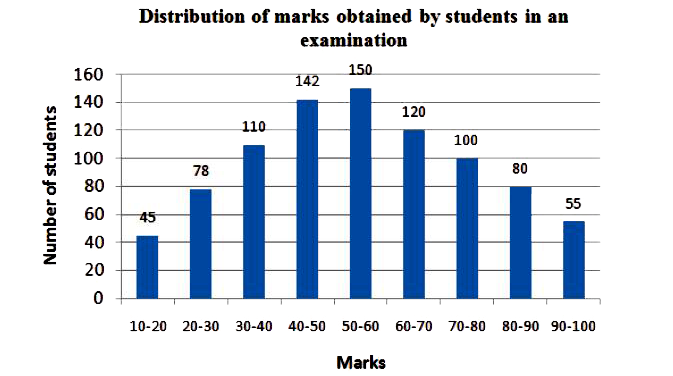
The number of students who obtained 20 marks or more but less than 60 marks is :
View SolutionIn each of the following questions, the following histogram shows the relationship between the marks obtained by the students and the number of students in an examination. Study the histogram and answer the questions.
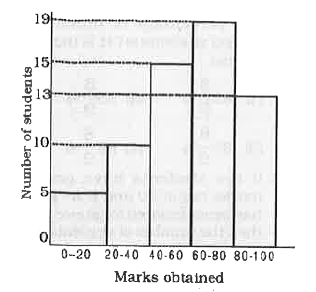
The ratio of the number of students who obtained 60 or more marks to that of students who obtained 60 or less marks is
View Solution
