What is the average production of rice in state A over the years.
5.9
5.8
6
6.1
The correct Answer is:C
Step by step video & text solution for What is the average production of rice in state A over the years. by Maths experts to help you in doubts & scoring excellent marks in Class 14 exams.
Similar Questions
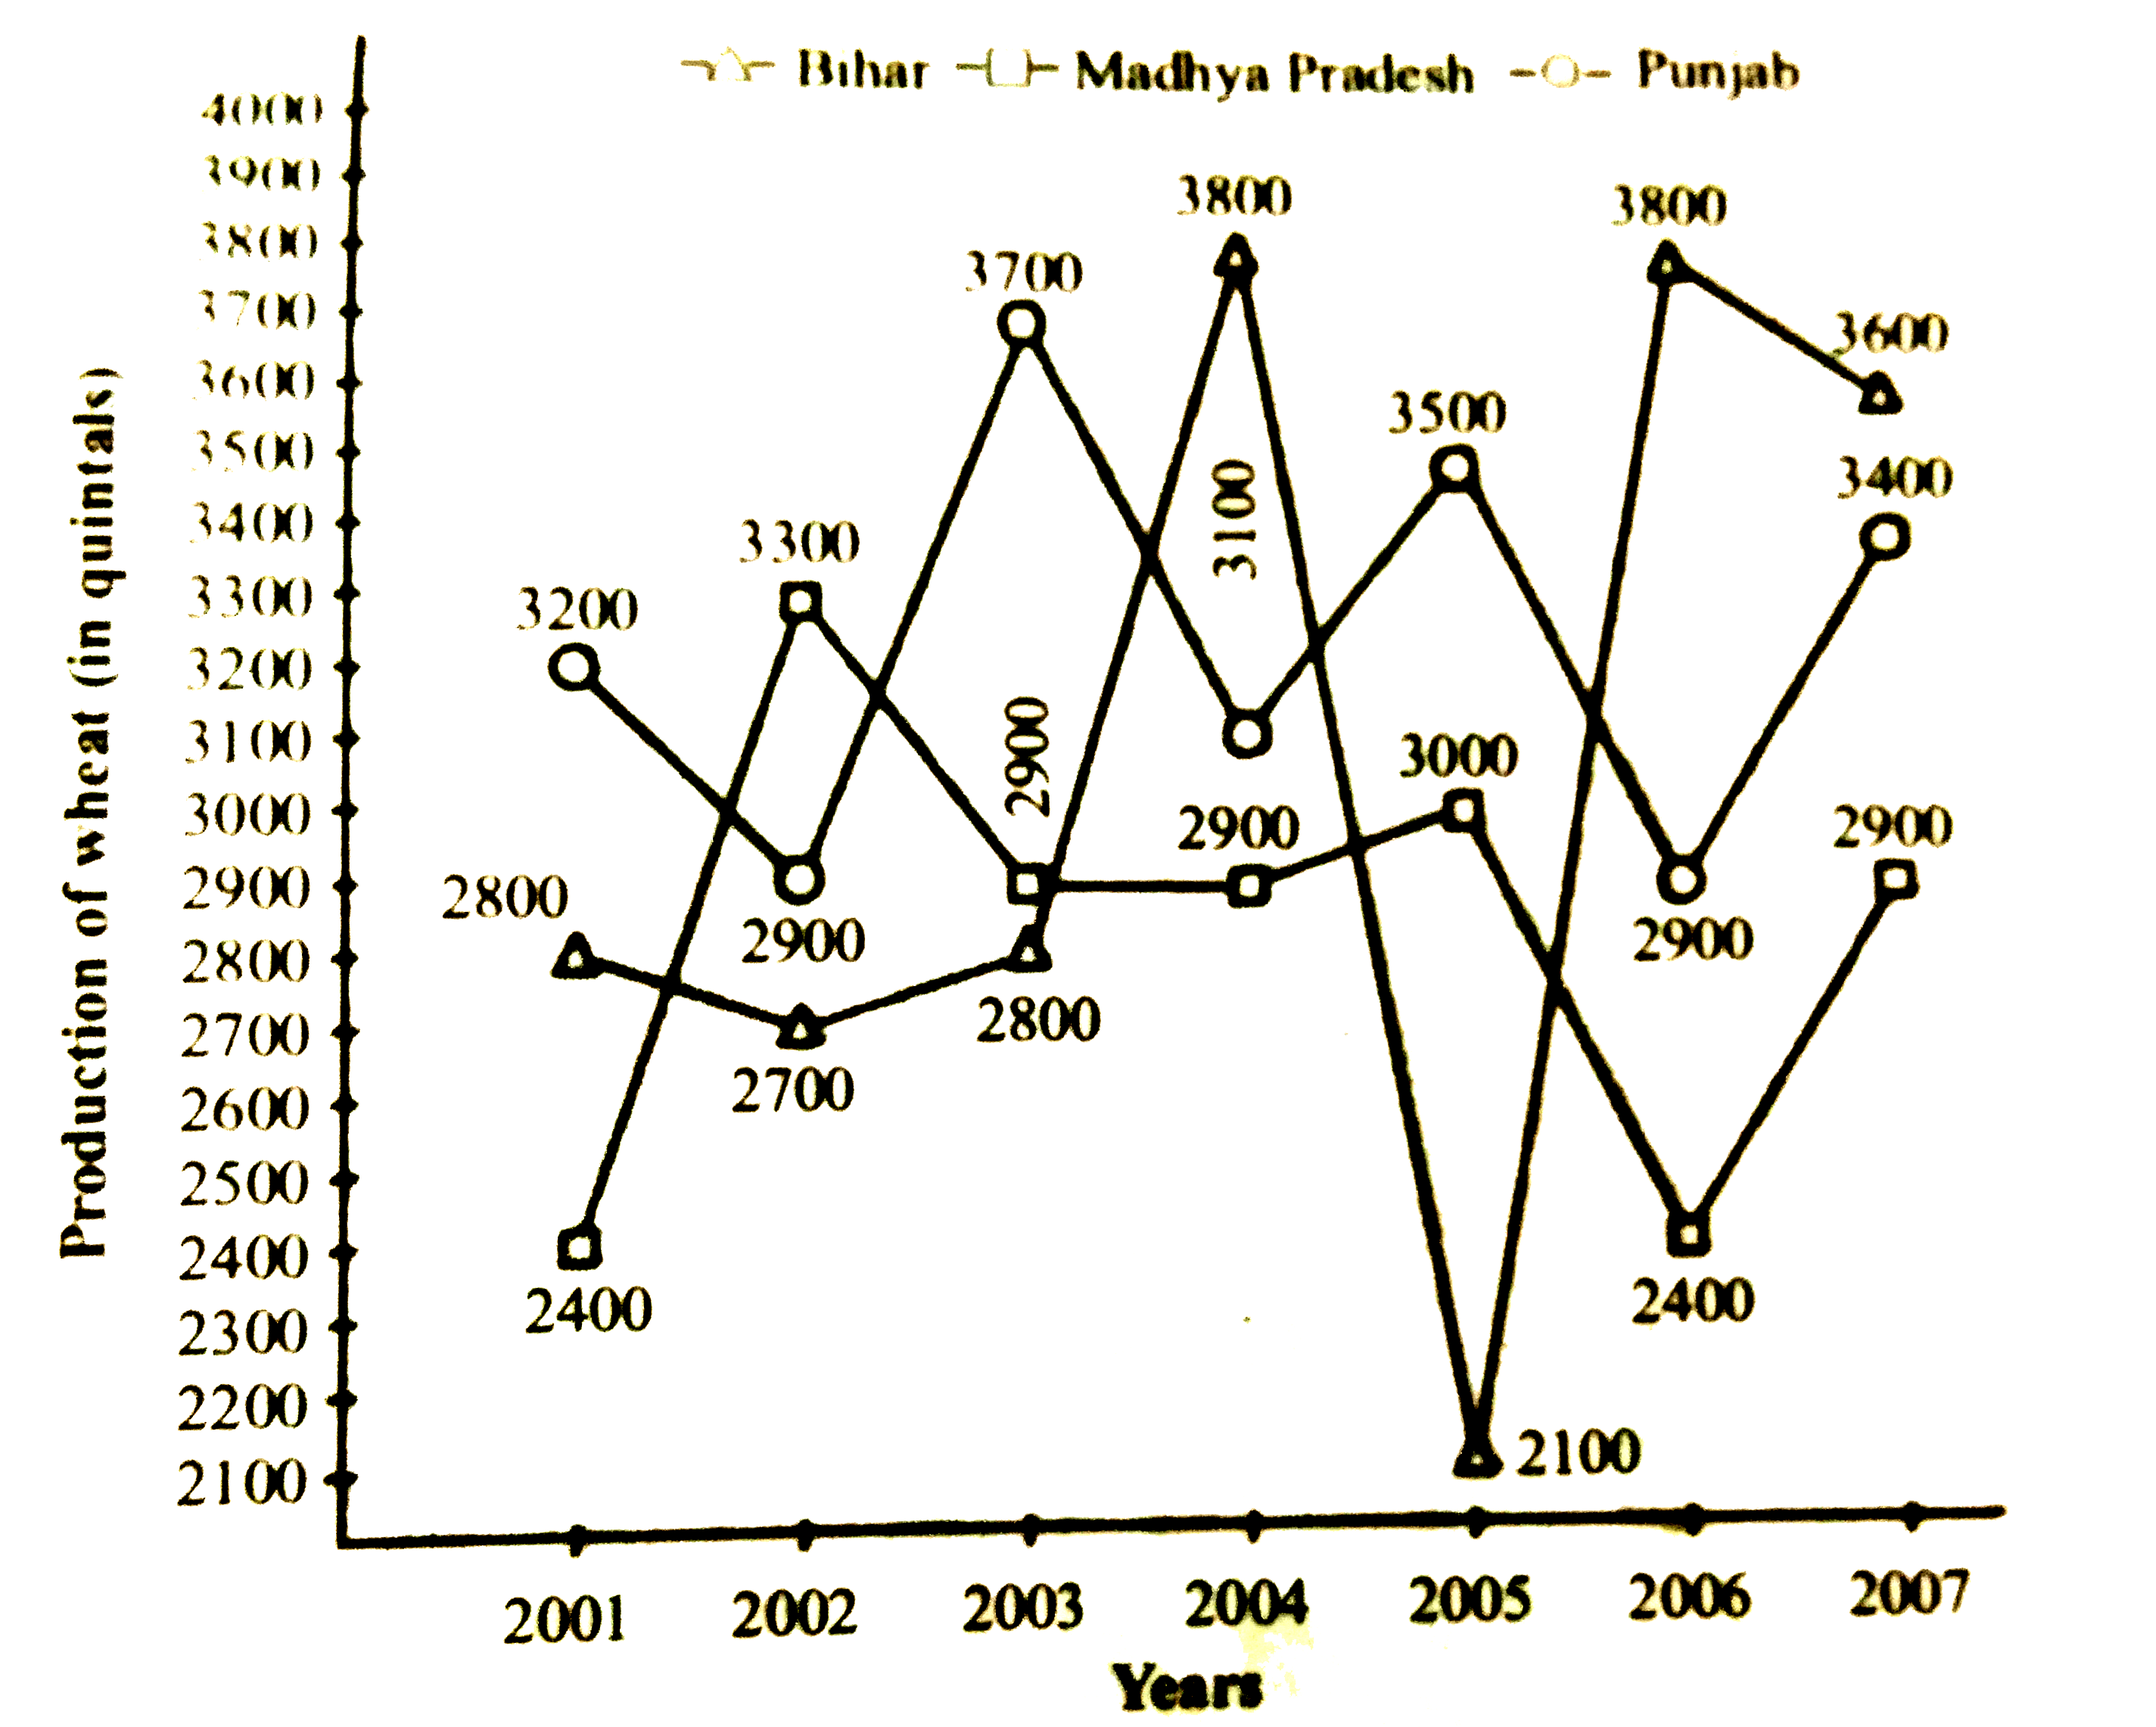
If the productions of wheat in Bihar in the years 2001,2002, 2003 and 2004 increases by 20%,25%,28% and 35% respectively , what will be the percentage increases in the average production of the state for the given years ?View SolutionThe below table gives rice production in each year. Read and answer the following questions.
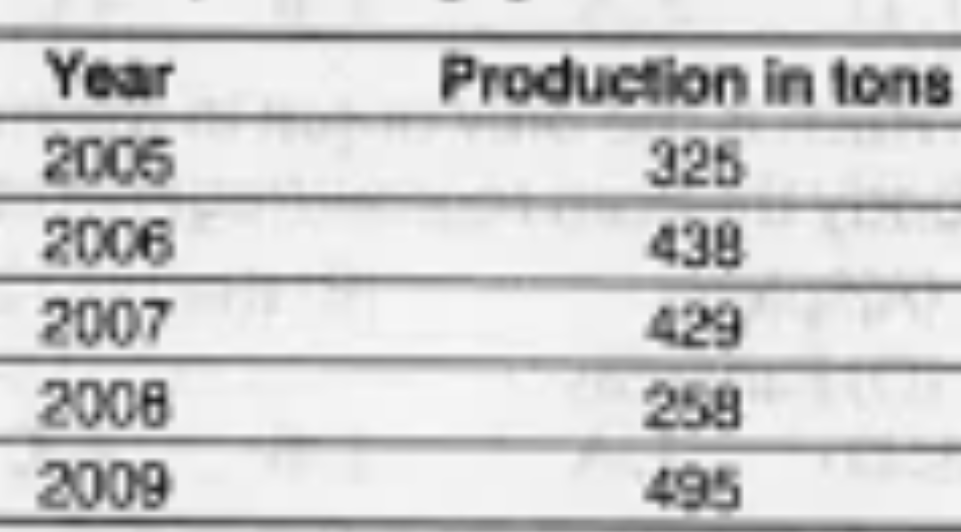
What was the average production of rice in the period 2005-2009?
378
389
399
412View Solution
Knowledge Check
- Question 1 - Select One
What is the production of rice in 1949-50?
A116263.63B1,23,460C1,40,679Dnone of these - Question 2 - Select One
Rs. 5000 becomes Rs. 6200 in 4 years at a certain rate of interest. If the rate becomes 1.5 times of itself, the amount of the same principal in 5 years will be
A(a) 5536B(b) 5996C(c) 6886D(d) 7250 - Question 3 - Select One
Study the table graph carefully to answer the questions that follows
Production of main crops in India (in million tonnes)
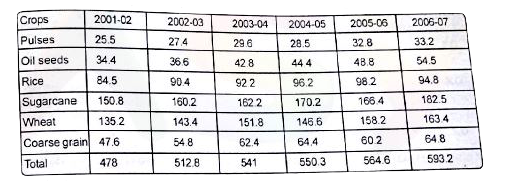
What was the average production of rice in the given years?A98 Million tonnesB95 Million tonnesC92.38 Million tonnesD100 Million tonnes
Study the bar graph and answer the question
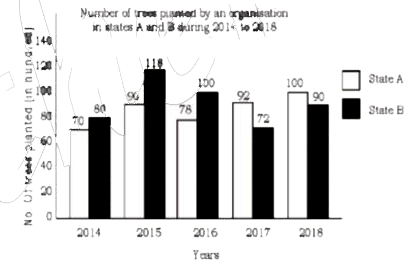
In how many years was the number of trees planted in state B more than the average number of trees planted in state A over the yearsView SolutionStudy the graph carefully and answer the following questions.
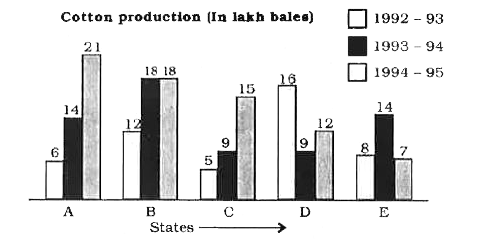
What is the average production of the four states in the year 1994-95 taken together ?View SolutionRead the following graph carefully and answer the questions given below.
Production of sugar in three different factories over years (in thousand tonnes)
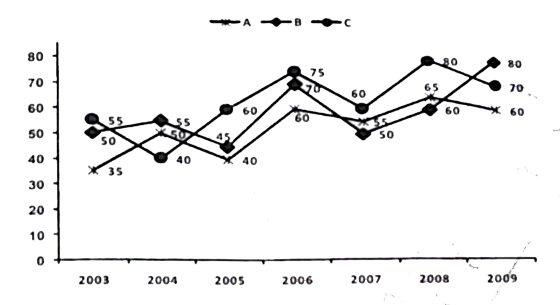
What is the average production of company C in all the years ?View SolutionThe below table gives rice production in each year. Read and answer the following questions
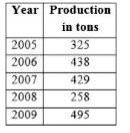
What was the average production of rice in the period 2005 -2009 ?
A 378 B 389 C 399 D 412View SolutionThe table shows the production of different types of cars (in thousands).
यह तालिका अलग-अलग प्रकार के कारों का उत्पादन ( हज़ार में) दर्शाती है |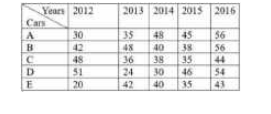 The number of years, in which the production of cars of type B is less than the average production of type D cars over the years is:
कितने वर्ष B प्रकार की कारों का उत्पादन इन वर्षों के दौरान D प्रकार की कारों के औसत उत्पादन से कम रहा है ?View Solution
