The line graph shows the monthly expenditure by two families in hundreds
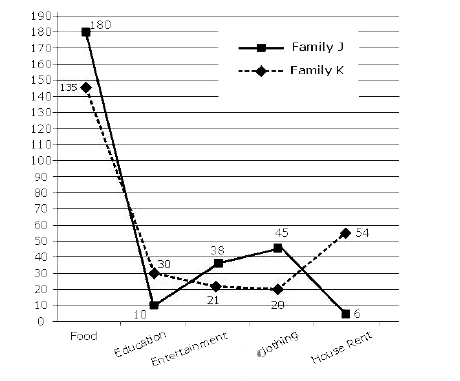
In the given line graph if the monthly income of Family K increase to 37200 what will be the increase in expenditure on entertainment
50.7
43.8
46.2
51.9
The correct Answer is:A
Step by step video & text solution for The line graph shows the monthly expenditure by two families in hundreds In the given line graph if the monthly income of Family K increase to 37200 what will be the increase in expenditure on entertainment by Maths experts to help you in doubts & scoring excellent marks in Class 14 exams.
Updated on:21/07/2023Similar Questions
The line graph shows the monthly expenditure by two families in hundreds
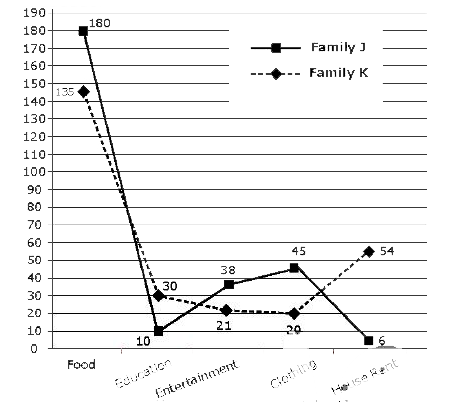
In the given line graph what is the difference in percentage of percentage of spending on food between family J and K?
View SolutionThe line graph shows the monthly expenditure by two families in hundreds
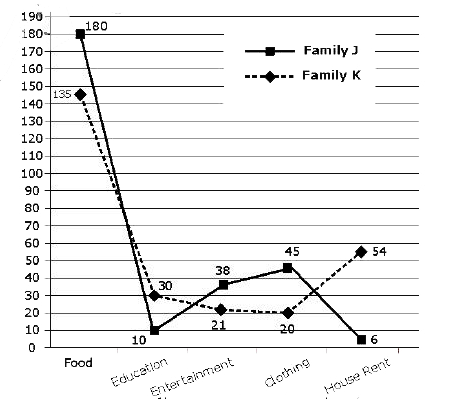
IN the given line graph, what is the ratio of the difference in spending between food and education for family J and k?
View Solution
Knowledge Check
The pie chart given below shows the monthly expenses on various heads of a family . The total expenditure of the family is Rs 30000.
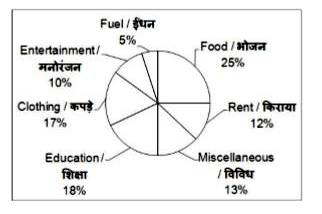
What is the difference (in Rs) between the amount spent on entertainment and clothing ?A2300B2700C1800D2100Following bar diagram shows the monthly expenditure of two families on food, clothing, education, fuel, house rent and miscellaneous (in percentage).
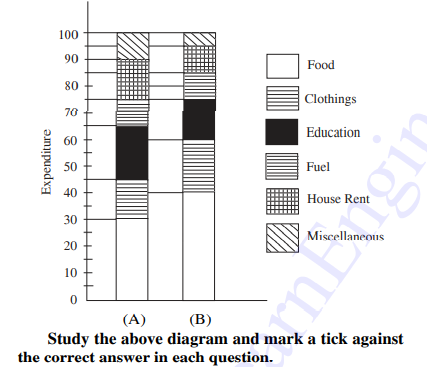
If both the families have the same expenditure, which one spends more on education and miscellaneous together ?AFamily ABFamily BCNoneDBoth equalThe bar diagram shows the monthly expenditure of a company. Study the graph and answer the questions.
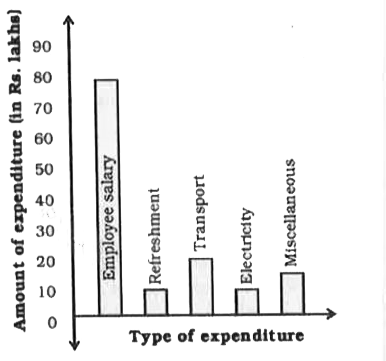
The fraction of money spent on refreshment is:A1312B227C110D10
Following table shows the monthly expenditure of Imran’s familyon various items.
View SolutionThe monthly income of 100 families are given as below
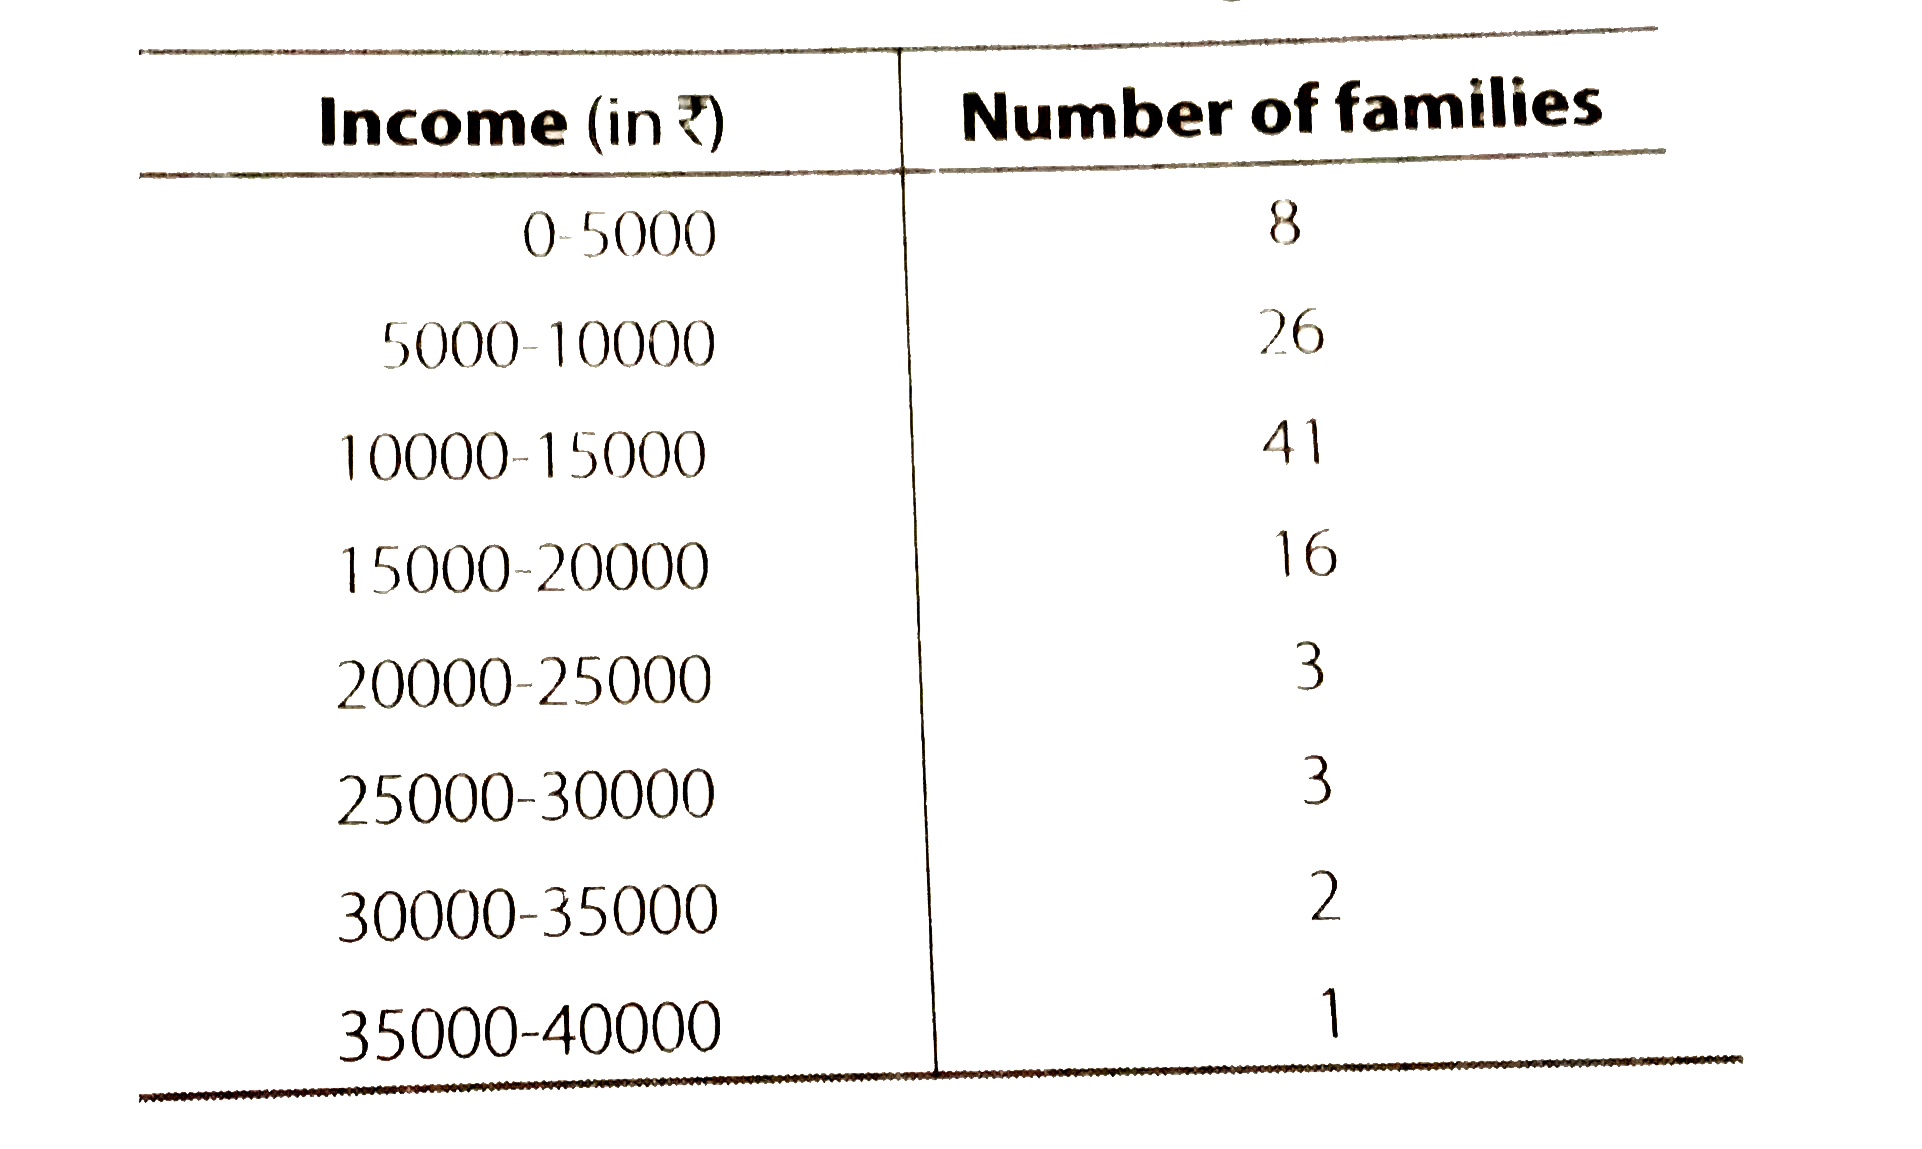
Calculate the modal income.
View SolutionThe following table shows the monthly expenditure of different families on different items :

Represent the data in the form of a sub-divided bar diagram.
View SolutionA family with a monthly income of Rs 20,000 had planned the following expenditures per month under various heads
View SolutionThe monthly expenditure of a family on different items is given in the following table. Calculate the related central angles.
View Solution
