The given bar chart presents the average marks obtained in English (E) and vernacular (V) by the students of five districts (D1, D2, D3, D4, D5)in a state at the secondary level examination of a particular year (marks secured out of a total of 100).
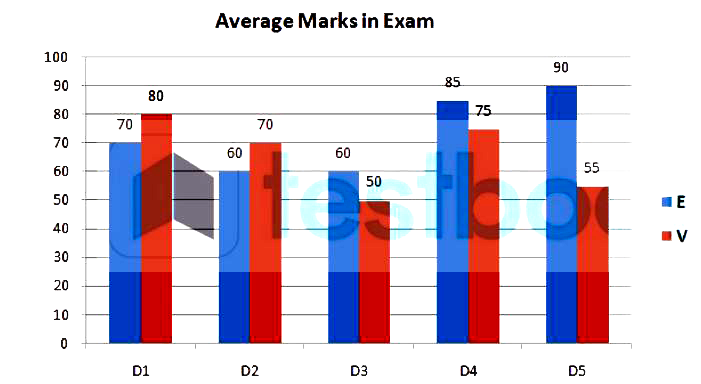
What is the difference between the average of marks in vernacular of the districts (D1, D2, D4) and (D3, D5)?
0.113
0.035
0.017
22.5
The correct Answer is:D
Step by step video, text & image solution for The given bar chart presents the average marks obtained in English (E) and vernacular (V) by the students of five districts (D1, D2, D3, D4, D5)in a state at the secondary level examination of a particular year (marks secured out of a total of 100). What is the difference between the average of marks in vernacular of the districts (D1, D2, D4) and (D3, D5)? by Maths experts to help you in doubts & scoring excellent marks in Class 14 exams.
Similar Questions
The given bar chart represents the average marks obtained in English E and vernacular by the students of five districts (D1 D2 D3 D4 and D5) in a state at the secondary level examination of a particular year
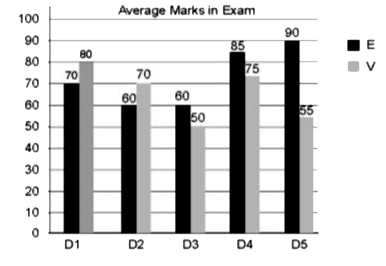
What is the average percentage of marks in English of the five districts?View SolutionThe table given below shows the marks obtained by 6 students in 3 subjects.
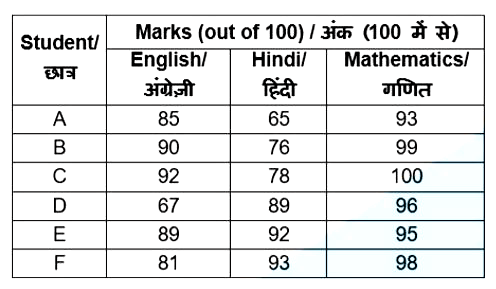
What are the average marks per subject scored by D?View Solution
Knowledge Check
- Question 1 - Select One
What is the difference between the marks obtained by the students in subjects B and D.
A20B27C30D12 - Question 2 - Select One
If the difference between the average of d and e and that of e and h is 19, what will be the difference between d and h?
A38B22C9D19 - Question 3 - Select One
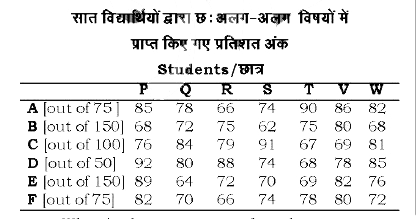
What is the difference between marks obtained by P and T in B , D and E subjectsA32.5B31.5C37D34
The given pie-chart shows the break-up of total marks obtained by a student in five subjects A, B, C, D and E. The maximum marks in each subject is 150 and he obtained a total of 600 marks.
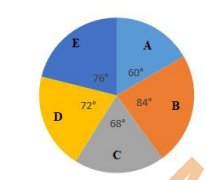 In how many subjects did the student obtain more than his average score?View Solution
If the difference between the average of d and e and that of e and h is 19, what will be the difference between d and h?
View SolutionWhat is the average percentage of marks obtained by all the students in subject C and D together.
View SolutionThe bar graph shows average marks scored in a 100 mark Science exam by students of 7 divisions of Standard X. Study the diagram and answer the following questions.
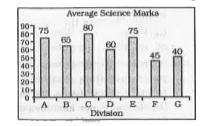
What is the raio of average marks scored by Division D to Division A?View SolutionStudy the Table Properly and answer by interpreting the data
The table shows the percentage population of five districts in a state below poverty line and the proportion of males and females.

If the total population in the distric D3 is 40,000, then what isthe population of below poverty line in the district D3?View Solution
