The give histogram represents the frequency distribution of average runs scored by 50 selected players from a district in a local cricket tournament
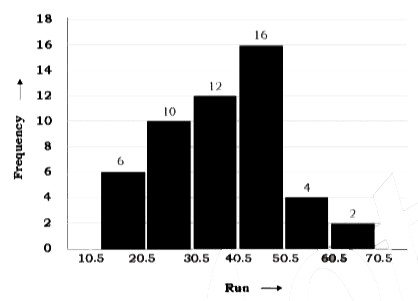
Which class of boundaries does the frequency of 10 correspond to
30.5 to 40.5
20.5 to 30.5
10.5 to 20.5
40.5 to 50.5
The correct Answer is:B
Step by step video & text solution for The give histogram represents the frequency distribution of average runs scored by 50 selected players from a district in a local cricket tournament Which class of boundaries does the frequency of 10 correspond to by Maths experts to help you in doubts & scoring excellent marks in Class 14 exams.
Updated on:21/07/2023Similar Questions
The given histogram represents the frequency distribution of average runs scored by 50 selected players from a district in a local cricket tournament
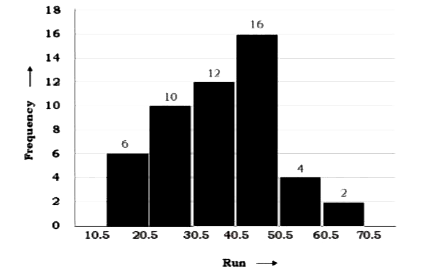
What is the overall average score of the 50 players.
View SolutionThe given histogram represents the frequency distribution of average runs scored by 50 selected players from a district in a local cricket tournament
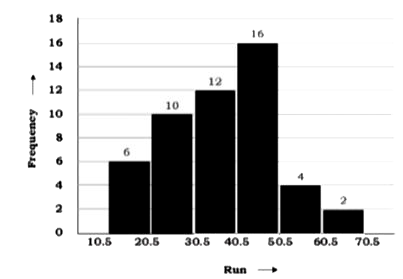
How many players scored more than 30.5 on average
View Solution
Knowledge Check
The given histogram represents the frequency distribution of average runs scored by 50 selected players from a district in a local cricket tournament.
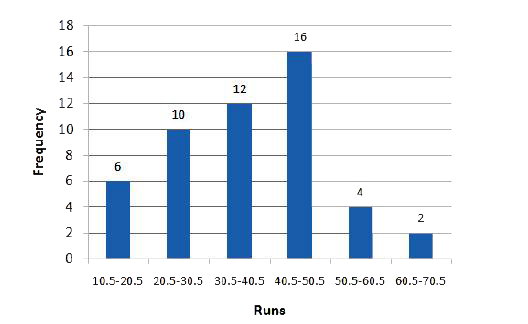
What is the overall average score of the 50 players?A37.1B29.3C32.6D38.5To draw a histogram to represent the following frequency distribution.
Class Interval 5−1010−1515−2525−4545−75
Frequency 6 12 10 8 15
The adjusted frequency for the class 25−45 isA6B5C3D2Consider the following statements in respect of histogram.
I. The algebraic sum of deviations of a set of n values from its atithmetic mean is zero.
II In the case of frequency distribution, mode is the value of variable which corresponds to maximam frequency Which of the above statement (s) is/are correct?AOnly IBOnly IICBoth I and IIDNeither I nor 2
Given below is a cumulative frequency distribution showing the mars secured by 50 students of a class

From the frequency distribution table for the data.
View SolutionRead the following text and answer the following question on the basis of the same.
100 surnames were randomly picked up from a local telephone directory and the frequency distribution of the number of letters in the English alphabets in the surnames was obtained as follows:
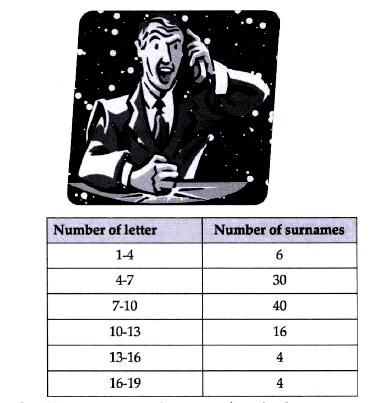
Cumulative frequency of modian class:
View SolutionLet us now consider the following frequency distribution table which gives the weights of 38 students of a class:
View SolutionConsider the following statements pertaining to a frequency polygon of a frequency distribution of a continuous variable with seven class intervals of equal width:
1. The original frequency distribution can be reconstructed from the frequency polygon.
2. The frequency polygon touches the x-axis in its extreme right and extreme left.
Which of the above statements is/are correct?
View SolutionClass Interval1−56−1011−1516−20Frequency3765
Consider the following statement is respect of the above frequency distribution.
I. The median is contained in the modal class.
II. The distribution is bell-shaped.
Which of the above statement is/are correct?
View Solution
