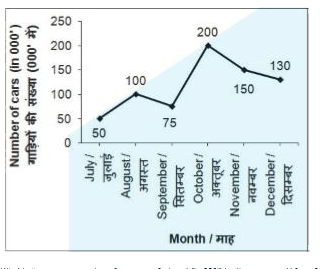
The line chart given blow shows the number of cars manufactured (in 000') by company X in year 2015 from the month of July to December.
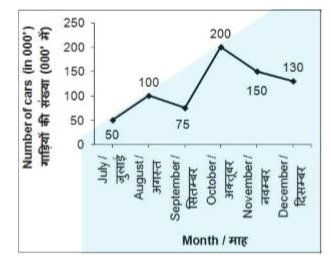
What is the percentage change in the number of cars manufactured in December to that in July?
130
80
160
140
The correct Answer is:A
Step by step video, text & image solution for The line chart given blow shows the number of cars manufactured (in 000') by company X in year 2015 from the month of July to December. What is the percentage change in the number of cars manufactured in December to that in July? by Maths experts to help you in doubts & scoring excellent marks in Class 14 exams.
Updated on:21/07/2023Similar Questions
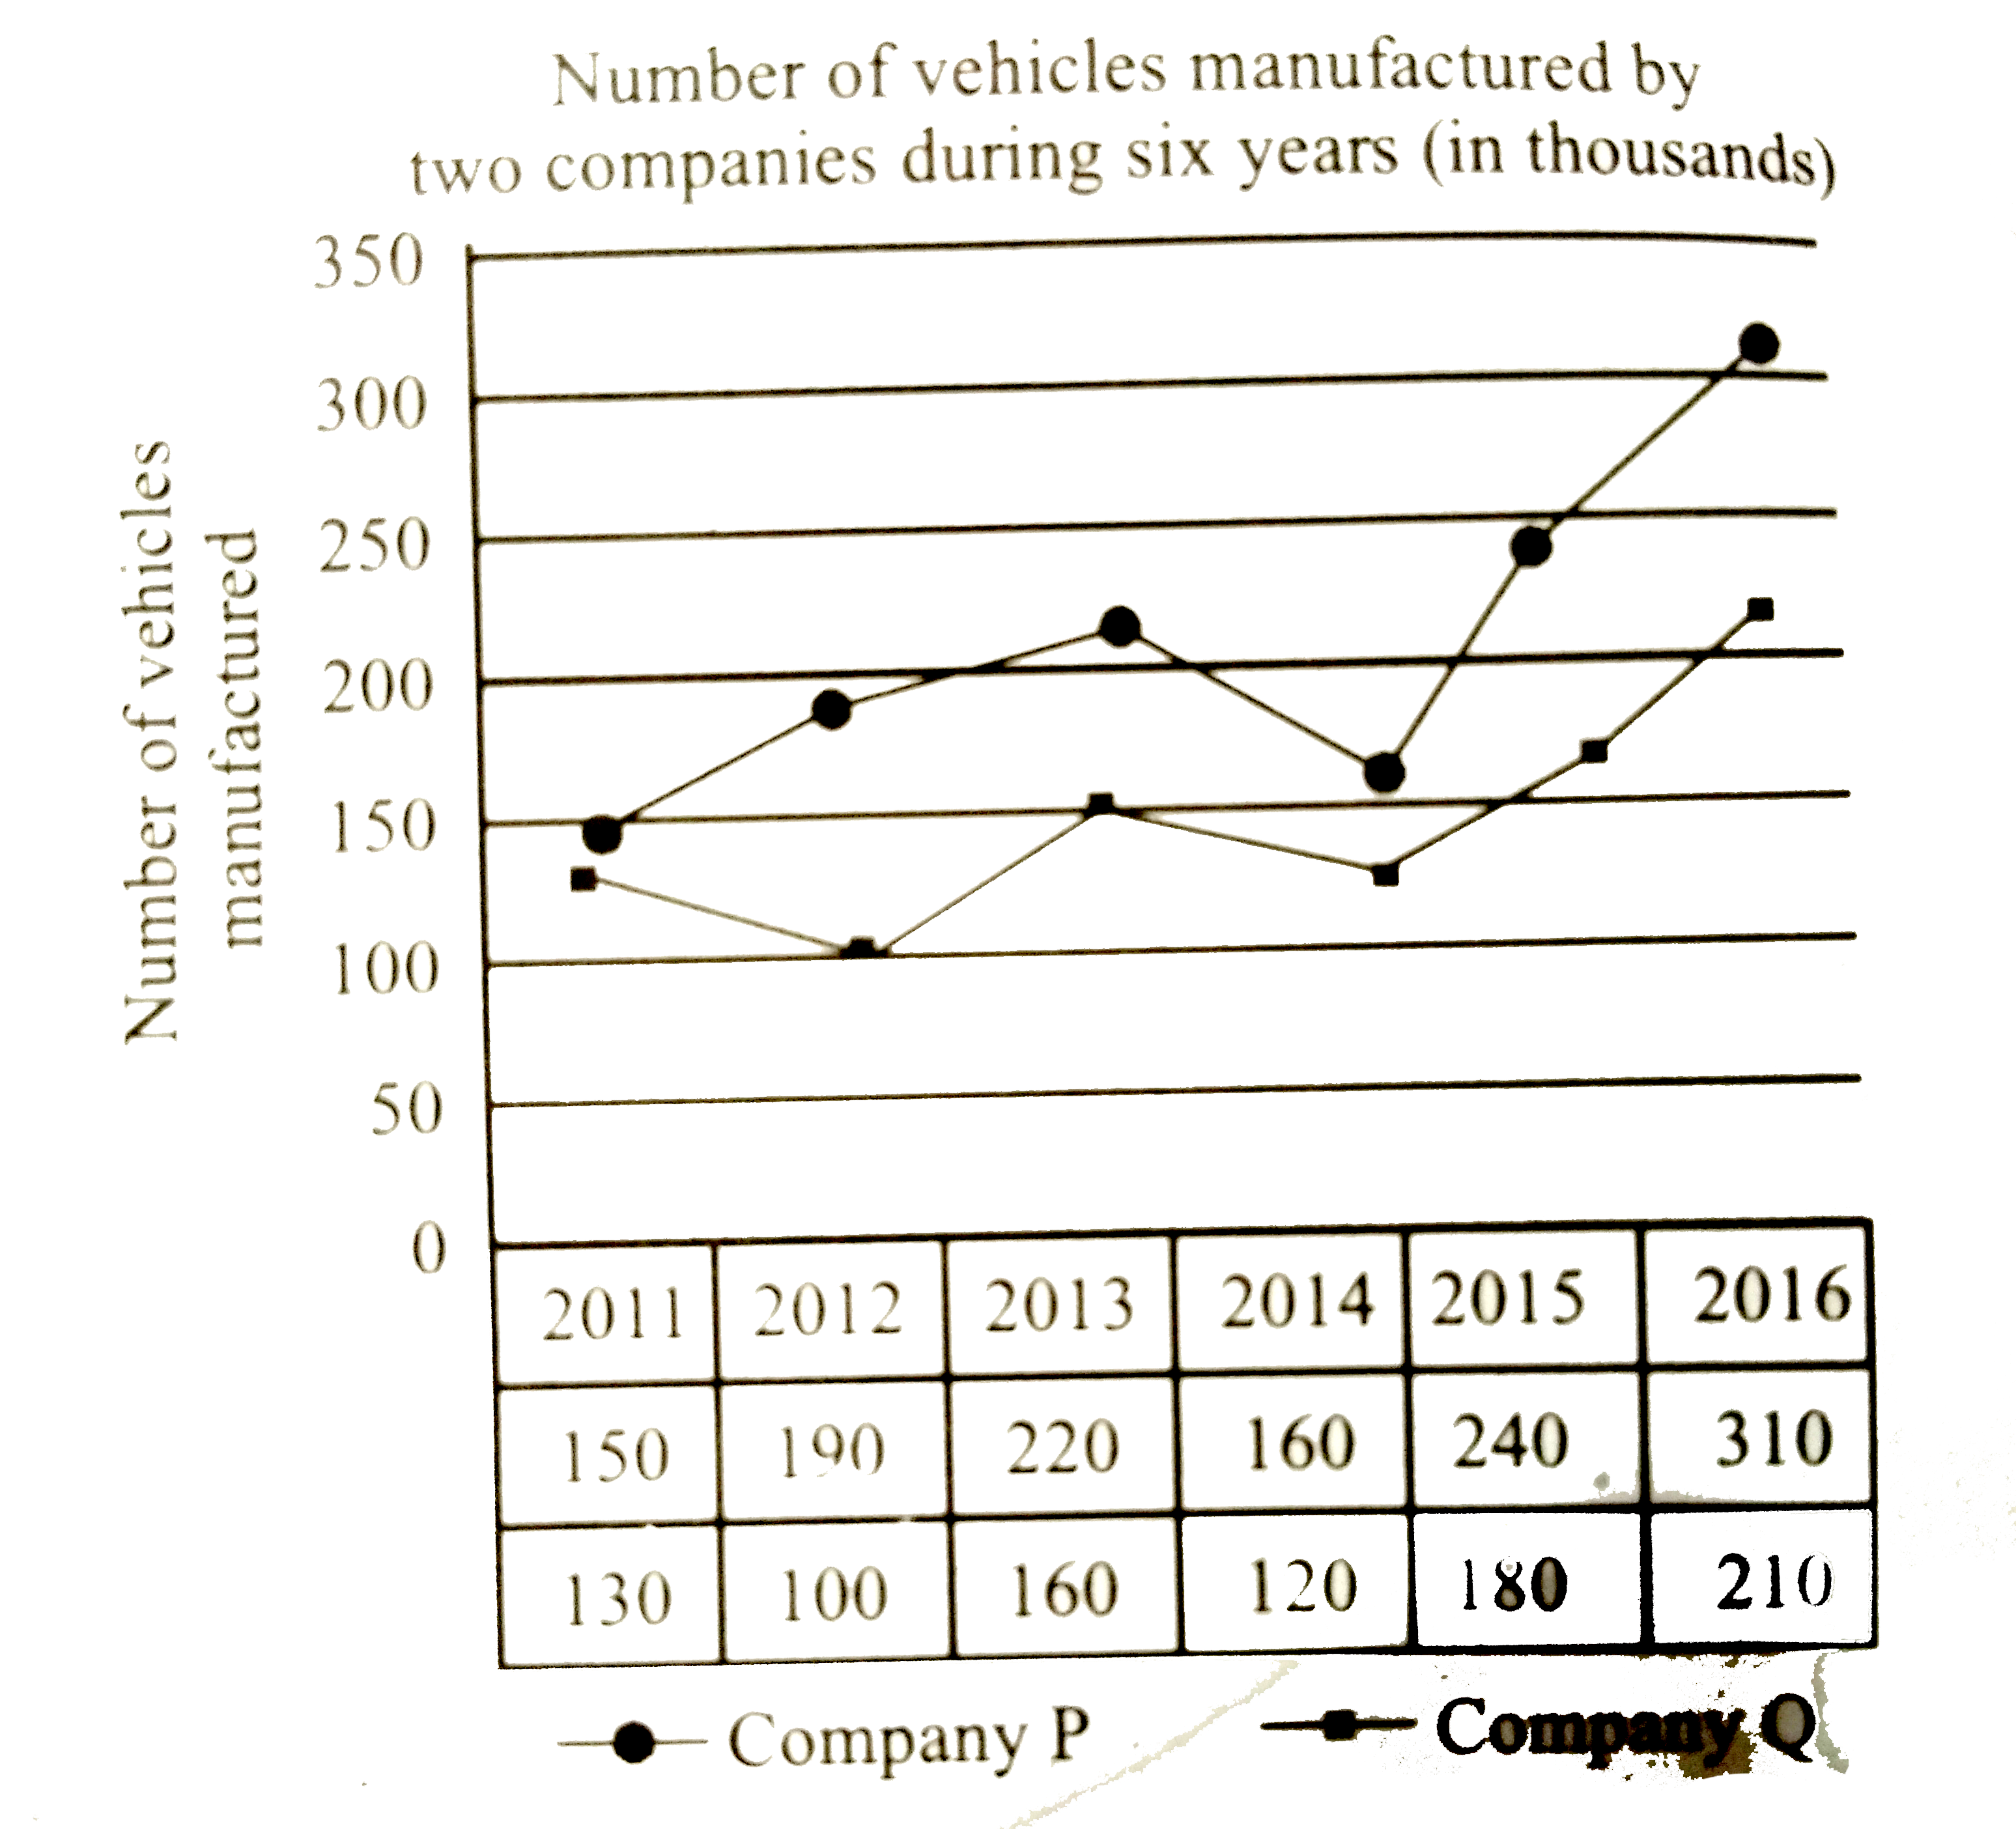
What is the percentage decrease in number of vehicles manufacture by both companies from 2013 to 2014 ?
View SolutionThe line chart given below shows the number of students in 2 sections X and Y from year 2009 to 2016.
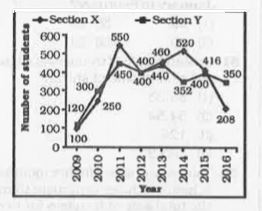
What is the percentage change in the number of students in section Y from year 2011 to year 2015?
View Solution
Knowledge Check
The line chart given blow shows the number of cars manufactured (in 000') by company X in year 2015 from the month of July to December.
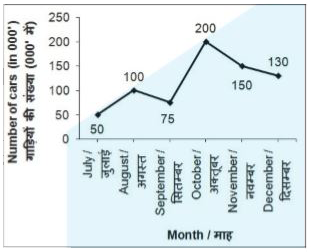
What is the difference between the maximum and minimum number of cars manufactured among the given months as a percentage of the cars manufactured in September?A250B300C150D200The line chart given blow shows the number of cars manufactured (in 000') by company X in year 2015 from the month of July to December.
What is the average number of cars manufactured (in 000') by the company X from July to November?A105B100C115D141The line chart given blow shows the number of cars manufactured (in 000') by company X in year 2015 from the month of July to December.
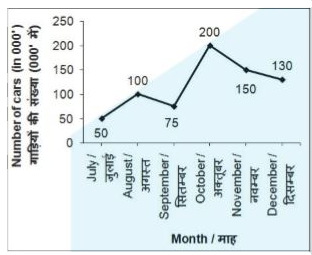
In how many months was the number of cars manufactured a multiple of 10,000?A6B5C4D7
The line chart given below shows the sales (in crores) of company A and B from July to December.
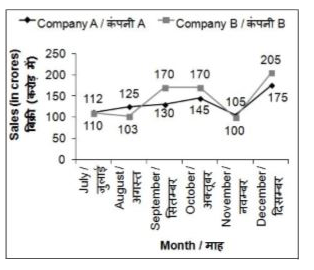
What is the average sale (in crore Rs) of company B in the given six months?
View SolutionThe bar chart given below shows the number of cars sold by brand A and B for the year for 2008 to 2016
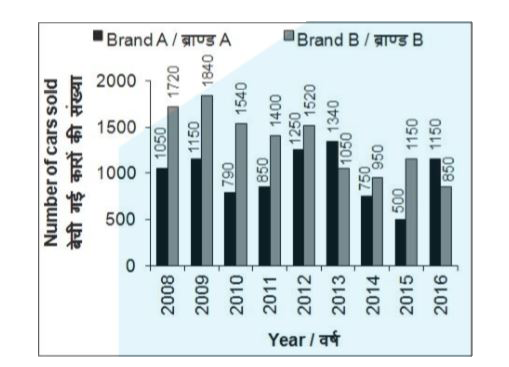
What is the percentage decrease in the number of car sold in year 2015 from year 2014 for brand A?
View SolutionThe table given below shows the number of students admitted in 2 sections X and Y from year 2011 to 2015.
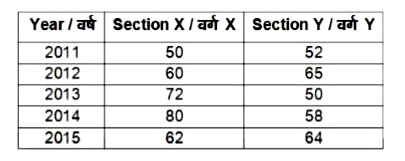
What is the percentage change in the number of students admitted in section X from year 2011 to 2013?
View SolutionThe table given below shows the number of students admitted in 2 sections X and Y from year 2011 to 2015.
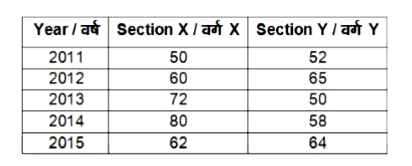
What is the percentage change in the number of students admitted in section Y from year 2011 to 2014?
View SolutionThe line chart given below shows the sales (in crores) of company A and B from July to December.
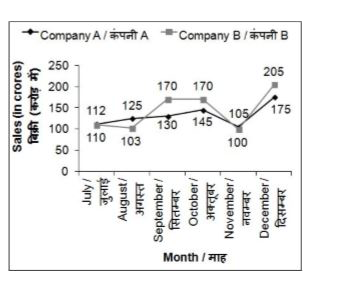
The sales of company B is same in which two months?
View Solution
