The following Bar Diagram depicts figures for some agricultural imports from January-May, 2008. Answer (as closely as possible) the questions using the date provided here
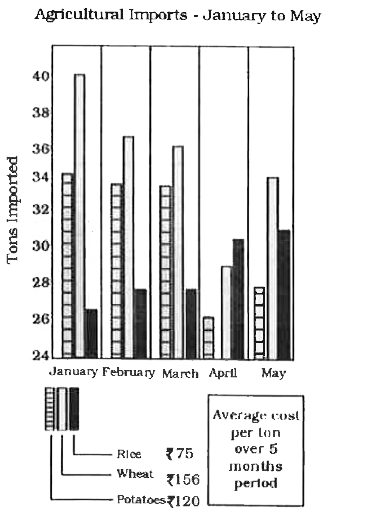
What was the total cost (in Rs) of wheat import in March?
Rs 3,212
Rs 6,616
Rs 7.042
Rs 2,224
The correct Answer is:B
Step by step video, text & image solution for The following Bar Diagram depicts figures for some agricultural imports from January-May, 2008. Answer (as closely as possible) the questions using the date provided here What was the total cost (in Rs) of wheat import in March? by Maths experts to help you in doubts & scoring excellent marks in Class 14 exams.
Updated on:21/07/2023Similar Questions
The following diagram depicts various views of a cube. Each faces has some number, where as in cube 4, one face is blank. From the answer choices select the number that should come in the blank space.
Question Figures

View SolutionRead the following bar graph and answer the questions for (Q.No−30→32)What is the income of the company between January and March? What is the profit percentage in the month of April?What is the ratio of the income to expenditure from January to June?
View Solution
Knowledge Check
The following Bar Diagram dpeicts figures for some agricultural imports from January-May, 2008. Answer (as closely as possible) the questions using the date provided here
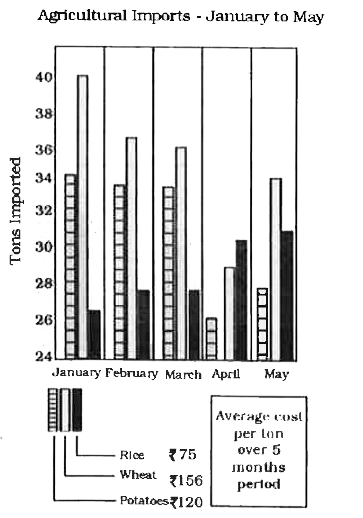
What is the average cost of potato import in February and March?A(a) Rs 3,960B(b) Rs 5,960C(c) Rs 1,280D(d) Rs 4,440The following bar diagram, represents the use of different modes of travel to school by students in a certain locality of the town. Study the graph and answer the questions.
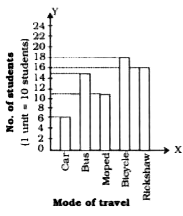
What is the percentage of students using Bus from that locality ?A221433%B1823%C22811%D0.22Students from different countries (A,B,C,D,E,F) participated in a certain seminar.The pie- chart shows how many students came from each of the six participating countries.Study the diagram and answer the following questions.
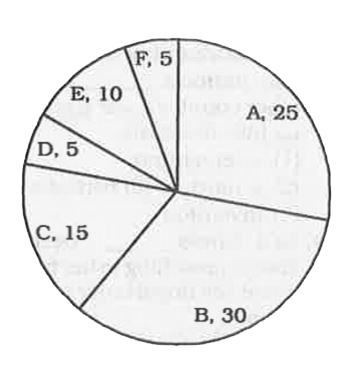
If the cost of total spending on transport for the seminar was Rs. 9 lakhs and the cost of hosting the students was Rs. 15000 per student then what was the ratio of hosting cost of all the students to that of spending on transport?A2:5B3:2C1:1D1:2
'Study then following bar graph carefully and answer the questions.
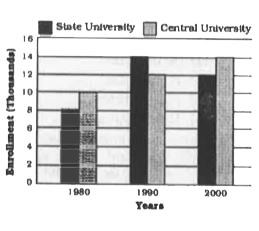
The tuition fee at State University in the year 2000 was Rs.6500 per enrollment.What was the total revenue collected from the tuition fee at State university during that year?
View SolutionThe following bar-diagram shows total number of males and females in five different organisations. Study it carefully to answer the questions.
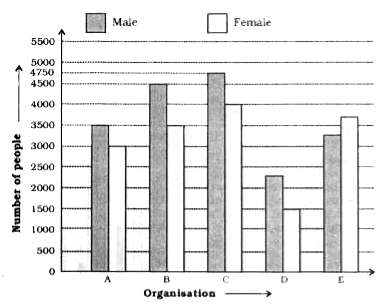
What is the difference between the total number of females and the total number of males from all the organisations together?
View SolutionThe bar graph shows the production of the different departments of a company. Study the diagram and answer the following questions.
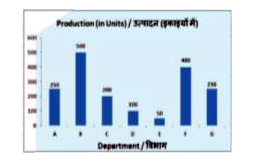
If the average cost a unit produced by department C is Rs 250 then what is the cost of the production (in Rs) of all units produced by department C?
View SolutionStudy the following bar graph carefully and answer the questions.
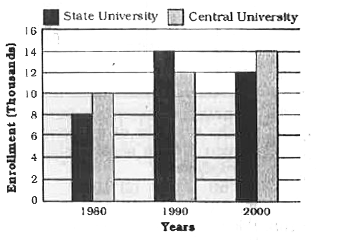
The tuition fee at State University in the year 2000 was Rs.6500 per nrolment. What was the total revenue collected from the tuition fee at State University during the year?
View SolutionThe bar graph shows the annual sales of the different departments of a company Study the diagram and answer the following questions.
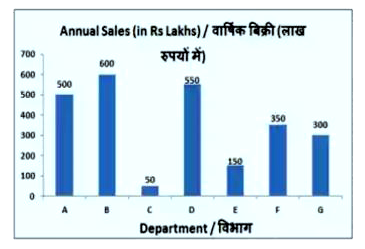
If the company has only 7 departments then what is the annual profit (in Rs lakhs) of the company if the annual profit was 10% of the total annual sales of the company?
View Solution