The Pie Chart shows the angular representation of five different Employment sectors. The total number of employees in these five sectors is 7,20,000.
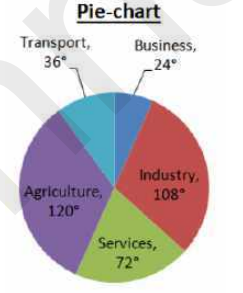 How much percent employees are in Service Sector?
72%
36%
20%
25%
The correct Answer is:C
Step by step video, text & image solution for The Pie Chart shows the angular representation of five different Employment sectors. The total number of employees in these five sectors is 7,20,000. How much percent employees are in Service Sector? by Maths experts to help you in doubts & scoring excellent marks in Class 14 exams.
Updated on:21/07/2023Similar Questions
The Pie Chart shows the angular representation of five different Employment sectors. The total number of employees in these five sectors is 7,20,000.
यह पाई-चार्ट पांच अलग-अलग रोज़गार क्षेत्रों के कोणीय प्रतिनिधित्व को दर्शाता है | इन पांच क्षेत्रों में कर्मचारियों की कुल संख्या 7,20,000 है| How much percent employees are in Service Sector?
कितने प्रतिशत कर्मचारी सैवा क्षेत्र में है?
View SolutionThe Pie Chart shows the angular representation of five different Employment sectors. The total number of employees in these five sectors is 7,20,000.
यह पाई-चार्ट पांच अलग-अलग रोज़गार क्षेत्रों के कोणीय प्रतिनिधित्व को दर्शाता है | इन पांच क्षेत्रों में कर्मचारियों की कुल संख्या 7,20,000 है|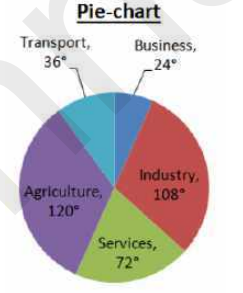 How many total employees are engaged in Agriculture, Business and Transport?
कृषि, व्यवसाय और परिवहन में कुल कितने कर्मचारी संलग्न हैं?
View Solution
Knowledge Check
The Pie Chart shows the angular representation of five different Empolyment sectors. The total number of employees in these five sectors is 7,20,000.
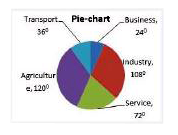
How many total employees are engaged in Agriculture, Business and Transport?A3,60,000B5,00,000C2,60,000D4,80,000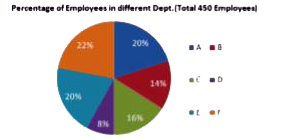
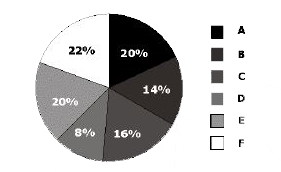
In the given pie-chart, what is the central angle of the sector representing the number of employees in the department D?A29.6∘B28.8∘C29.2∘D29.8∘The pie-chart shows the percentage-wise distribution of the number of students in five different schools P,Q,R,S and T .
The total number of students in all five schools together is 10,500 .
Study the pie -chart and answer the question .
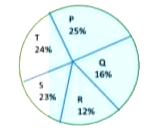
The difference between the central angles corresponding to schools T and R is :A42.8∘B44∘C43.2∘D34.5∘
The Pie Chart shows the angular representation of five different Employment sectors. The total number of employees in these five sectors is 7,20,000.
यह पाई-चार्ट पांच अलग-अलग रोज़गार क्षेत्रों के कोणीय प्रतिनिधित्व को दर्शाता है | इन पांच क्षेत्रों में कर्मचारियों की कुल संख्या 7,20,000 है|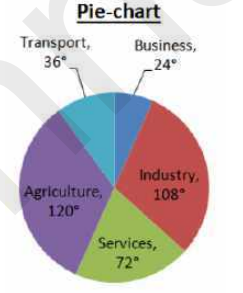 How many more employees are engaged in Industry than Business?
उद्योग में व्यवसाय की तुलना में कितने अधिक कर्मचारी संततग्न हैं ?
View Solution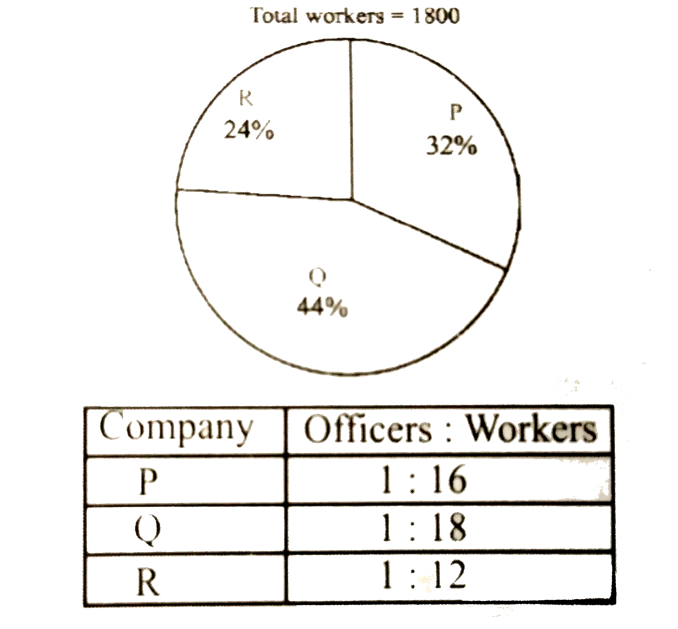
Total number of employees in company 'Q' is how much more than total number of employees in company R,
View SolutionThe given table shows the number (in percent) of employees working in different departments of an organization . The table also shows the ratio of males and females and the ratio of employees living in city Z and employees living in city Y . The total number of employees in the organization are 80000
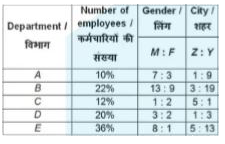
How mnay employees of department A and C together are living in ciry Z ?
View SolutionIn the given pie chart what is the central angle of the sector representing the number of employees in the department D?
View SolutionStudy the pie-chart and answer the question.
Distribution (degree wise ) of the total number of employeesofa company in its five offices A,B,C,D&E.
Total Number of employees = 9200
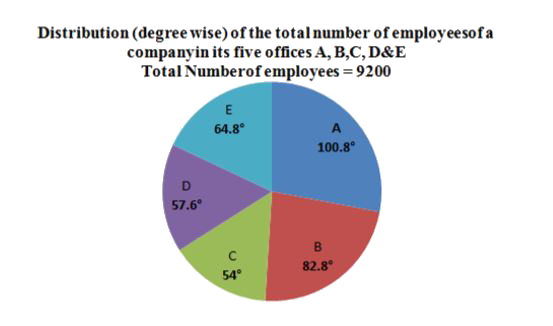
Total number of employees of the company in offices C and D exceeds the number of employees in office B by x, where X lies between:
View Solution
