The Pie Chart shows the angular representation of five different Employment sectors. The total number of employees in these five sectors is 7,20,000.|
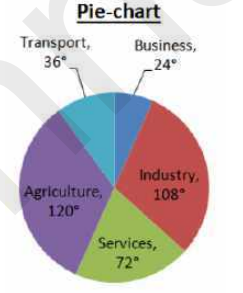 How many more employees are engaged in Industry than Business?
360000
168000
250000
26000
The correct Answer is:B
Step by step video, text & image solution for The Pie Chart shows the angular representation of five different Employment sectors. The total number of employees in these five sectors is 7,20,000.| How many more employees are engaged in Industry than Business? by Maths experts to help you in doubts & scoring excellent marks in Class 14 exams.
Updated on:21/07/2023Similar Questions
The Pie Chart shows the angular representation of five different Employment sectors. The total number of employees in these five sectors is 7,20,000.
यह पाई-चार्ट पांच अलग-अलग रोज़गार क्षेत्रों के कोणीय प्रतिनिधित्व को दर्शाता है | इन पांच क्षेत्रों में कर्मचारियों की कुल संख्या 7,20,000 है| How many more employees are engaged in Industry than Business?
उद्योग में व्यवसाय की तुलना में कितने अधिक कर्मचारी संततग्न हैं ?
View SolutionThe Pie Chart shows the angular representation of five different Employment sectors. The total number of employees in these five sectors is 7,20,000.
यह पाई-चार्ट पांच अलग-अलग रोज़गार क्षेत्रों के कोणीय प्रतिनिधित्व को दर्शाता है | इन पांच क्षेत्रों में कर्मचारियों की कुल संख्या 7,20,000 है|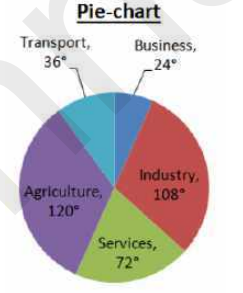 How many total employees are engaged in Agriculture, Business and Transport?
कृषि, व्यवसाय और परिवहन में कुल कितने कर्मचारी संलग्न हैं?
View Solution
Knowledge Check
The Pie Chart shows the angular representation of five different Empolyment sectors. The total number of employees in these five sectors is 7,20,000.
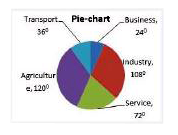
How many total employees are engaged in Agriculture, Business and Transport?A3,60,000B5,00,000C2,60,000D4,80,000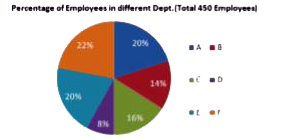
In the given pie-chart, what is the central angle of the sector representing the number of employees in the department D?A29.6∘B28.8∘C29.2∘D29.8∘Study the following line chart carefully and answer the questions given below it. The following line chart represents the number of employees recrulted in different years in a company.
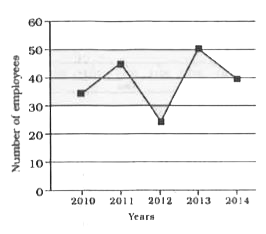
The number of employees recruited in 2015 was 40% more than that recruited in 2014. How many employees were recruited in 2015?A56B16C64D60
The Pie Chart shows the angular representation of five different Employment sectors. The total number of employees in these five sectors is 7,20,000.
यह पाई-चार्ट पांच अलग-अलग रोज़गार क्षेत्रों के कोणीय प्रतिनिधित्व को दर्शाता है | इन पांच क्षेत्रों में कर्मचारियों की कुल संख्या 7,20,000 है|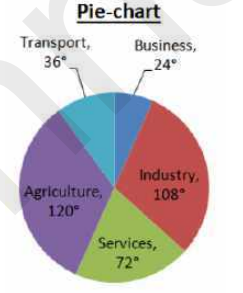 How much percent employees are in Service Sector?
कितने प्रतिशत कर्मचारी सैवा क्षेत्र में है?
View SolutionThe given table shows the number (in percent) of employees working in different departments of an organization . The table also shows the ratio of males and females and the ratio of employees living in city Z and employees living in city Y . The total number of employees in the organization are 80000
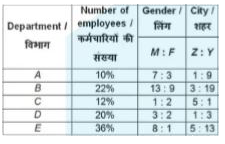
How mnay employees of department A and C together are living in ciry Z ?
View Solution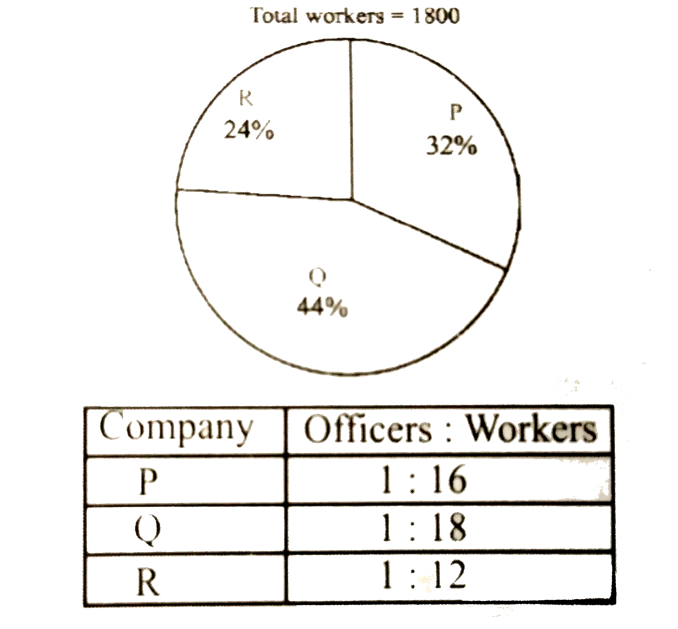
Total number of employees in company 'Q' is how much more than total number of employees in company R,
View SolutionIn the given pie chart what is the central angle of the sector representing the number of employees in the department D?
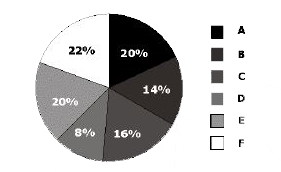
View SolutionIn the given pie chart if the total employees are 450 and female employees in department D is 75%, then how many male employees are in that department
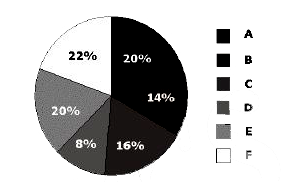
View Solution
