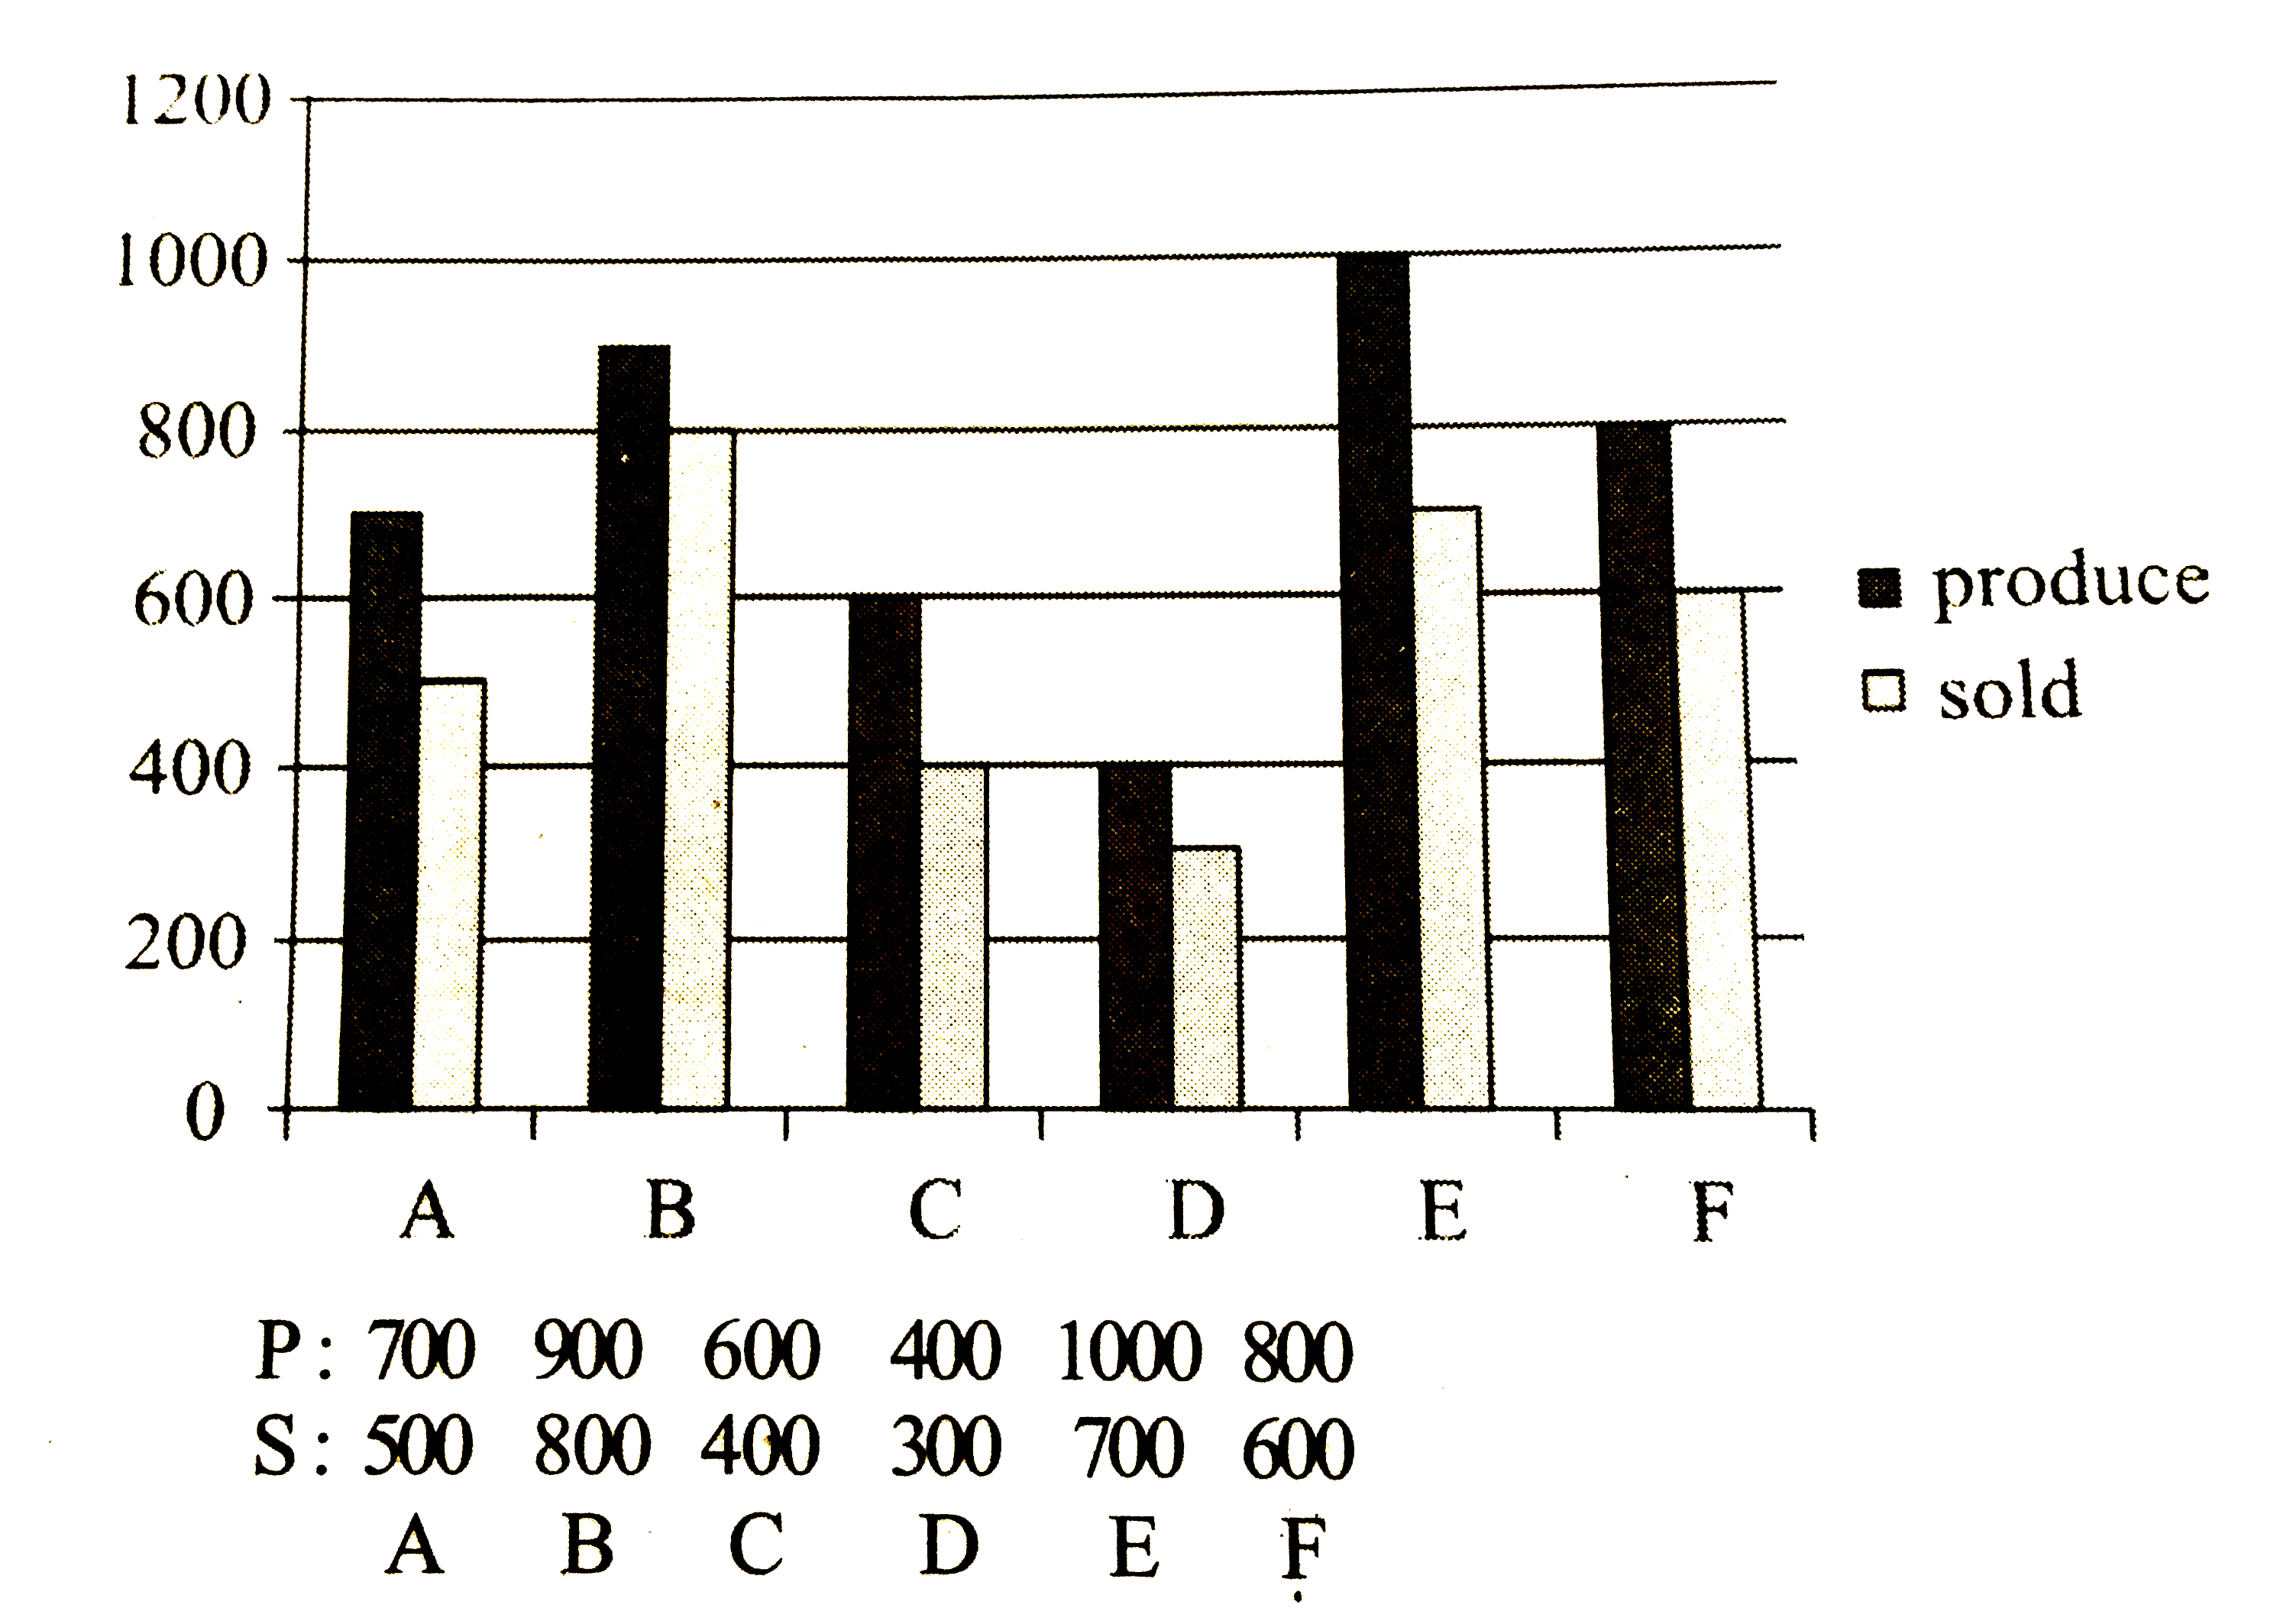
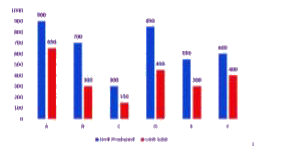
The Bar Graph shows the production and sales of Mobile handsets of various campanies A,B,C,D,E & F in a month.
The total units sold by Companies A,B and C together is approximately what per cent of the total produced by Companies A,B and C together (correct to nearest integer)?
50
58
62
76
The correct Answer is:B
Step by step video, text & image solution for The Bar Graph shows the production and sales of Mobile handsets of various campanies A,B,C,D,E & F in a month. The total units sold by Companies A,B and C together is approximately what per cent of the total produced by Companies A,B and C together (correct to nearest integer)? by Maths experts to help you in doubts & scoring excellent marks in Class 14 exams.
Updated on:21/07/2023Similar Questions
Knowledge Check
The Bar Graph shows the Production and Sales of Mobile handsets of various companies A,B,C,D,E & F in a month.
What is the average of Units produced by all the companies together?A625B675C600D650The Bar Graph shows the production and sales of Mobile handsets of various campanies A,B,C,D,E & F in a month.
Which Company had the highest percentage of sale with respect to its production?AABDCEDBThe total production of motorcycles of companies B and D taken together is what percent of the Demand of motorcycles of all the companies taken together?
A0.46B0.38C0.48D0.4
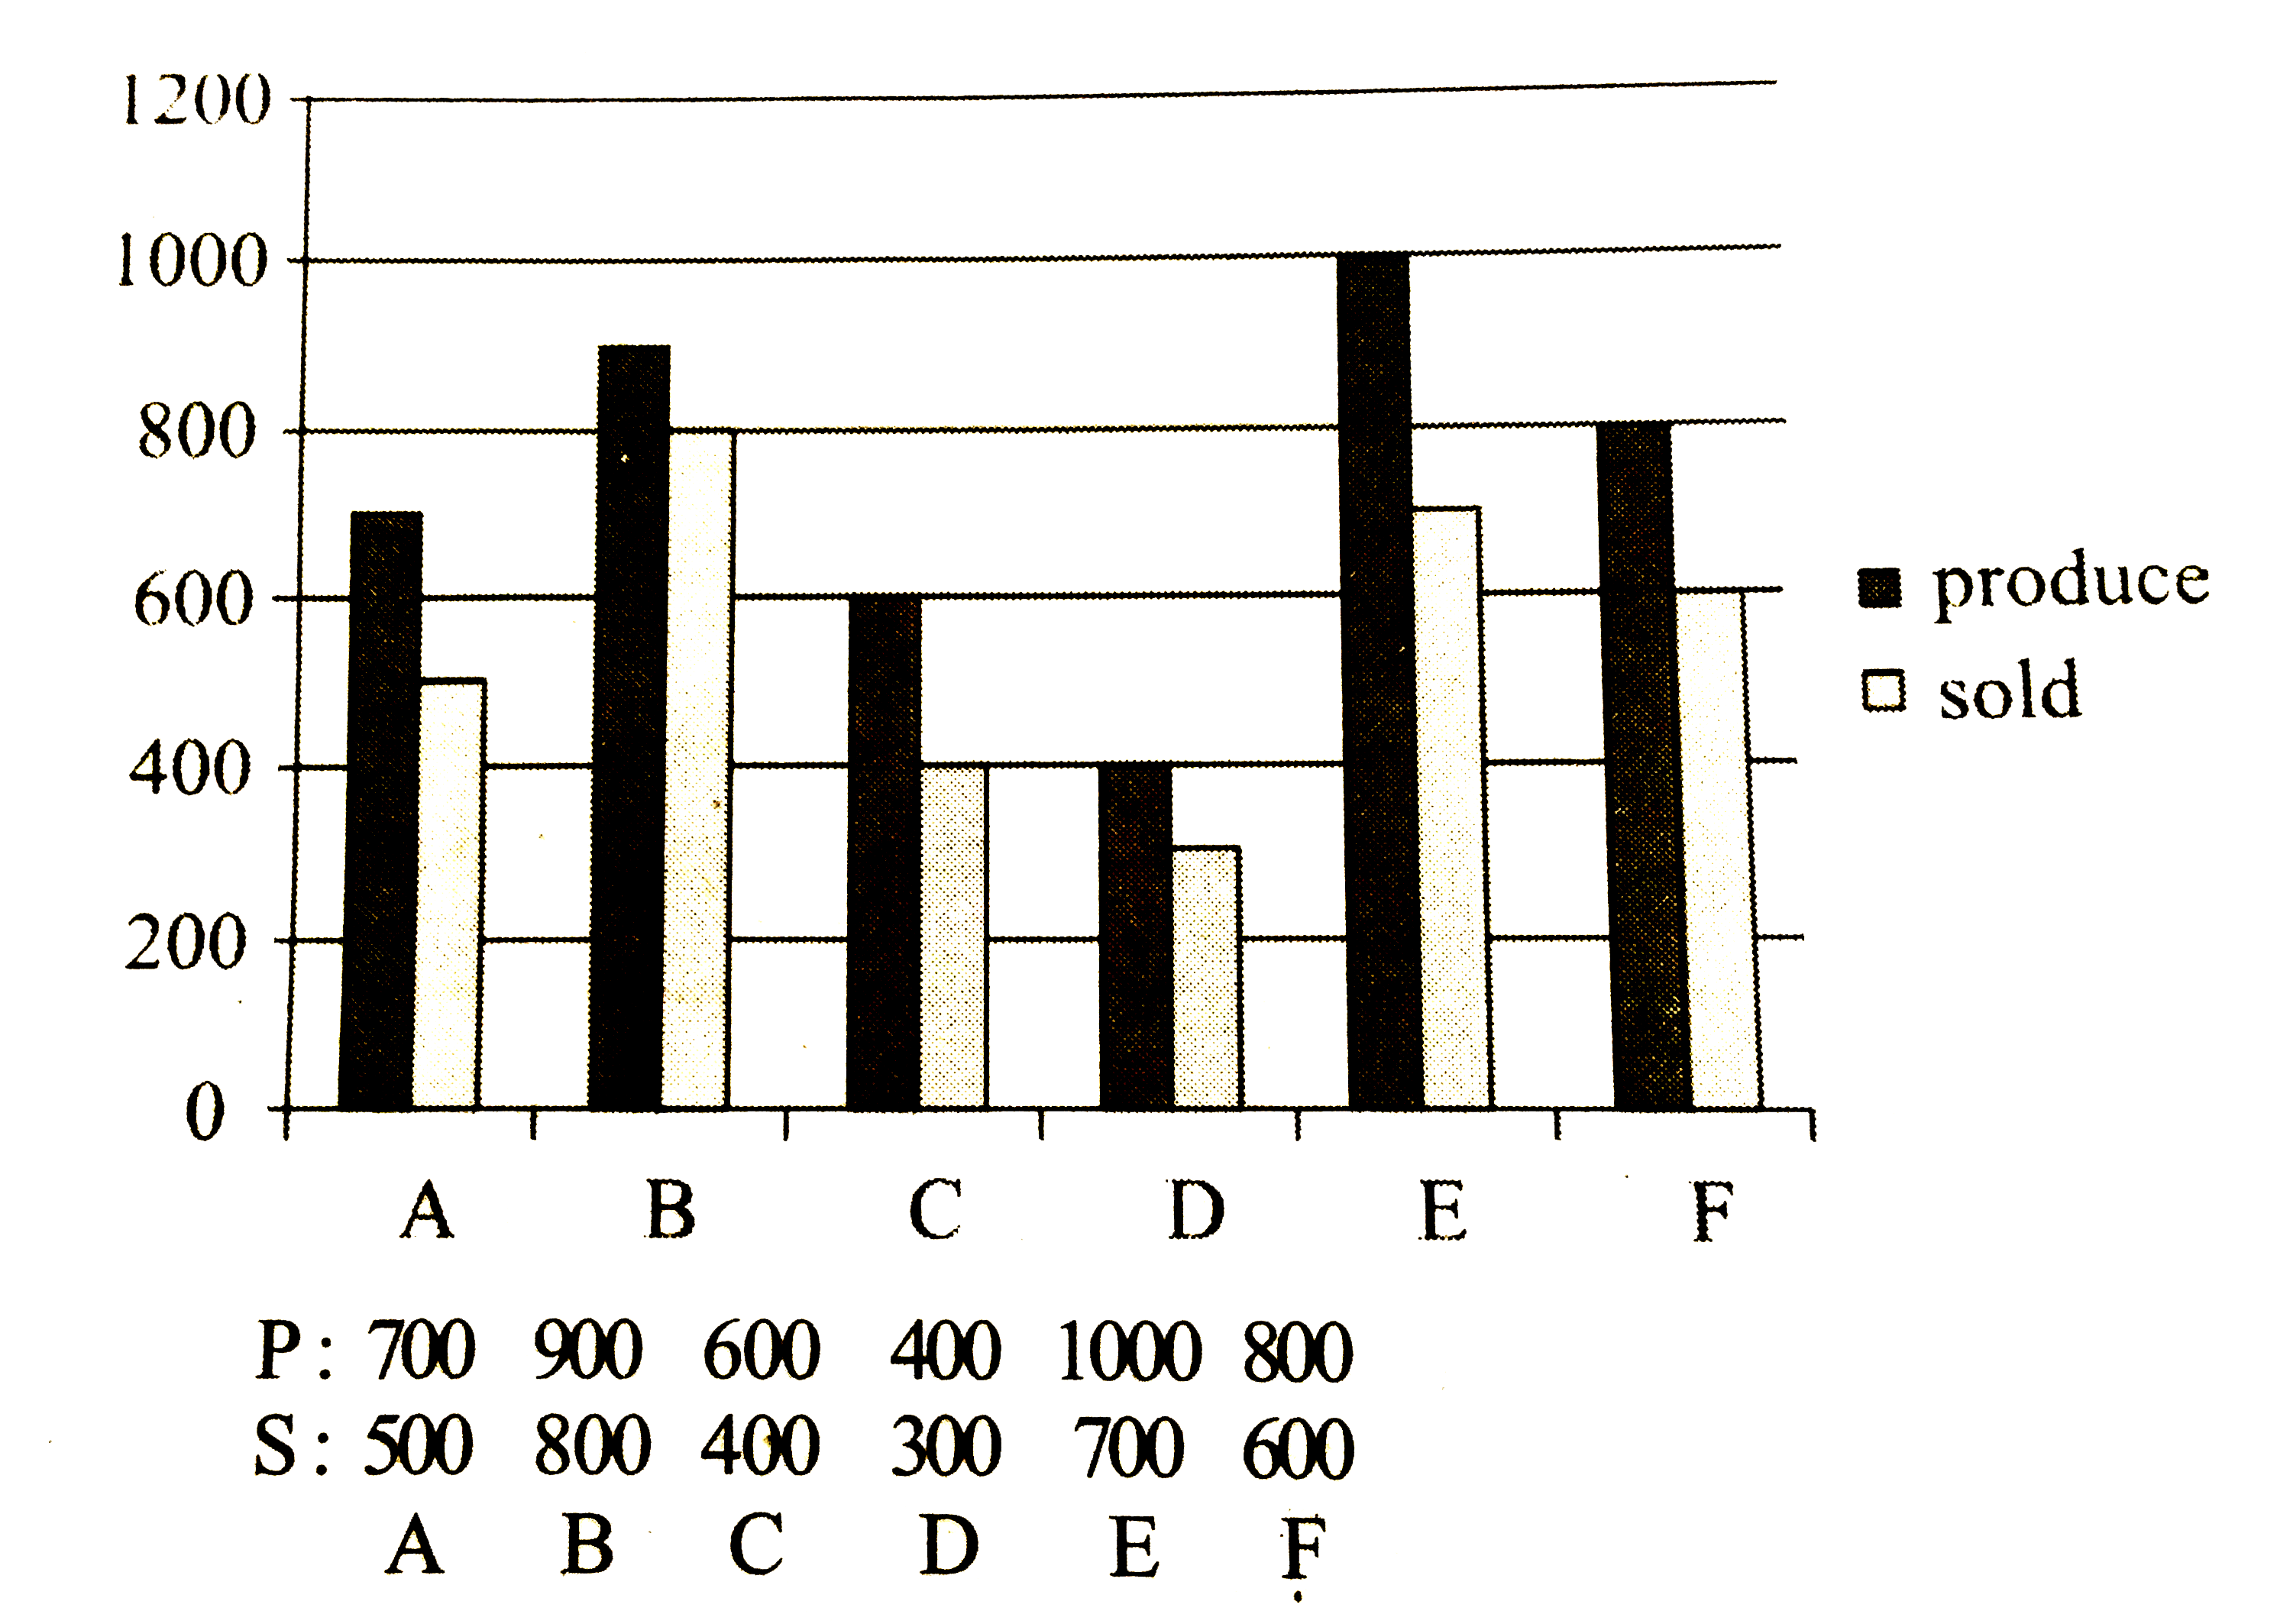
What is the ratio of the total production of the company B and C together to the total sales of the same companies ?
View SolutionThe given bar graph shows the production and sale of mobile handsets of five different companies A, B, C, D, E, & F during the period of one month.
दंड आरेख विभिन्न कंपनियों A, B, C, D, E & F की एक माह में मोबाइल हैंडसेट के उत्पादन और बिक्री को दर्शाता है |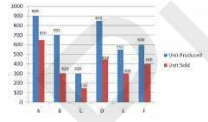
The units sold by the companies A, B and C, taken together, is approximately what percent of the total units produced by the companies A, B and C ? (to the nearest integer )
कंपनी A, B और C द्वारा कुल मिलाकर बिक्री की गई यूनिटें, कंपनी A, B और C द्वारा मिलाकर उत्पादित कुल यूनिटों का लगभग कितना प्रतिशत है (निकटतम पूर्णाक तक)?
View SolutionStudy the following graph carefully and answer the question given below it.
Production and sale of printers of various companies in a month.
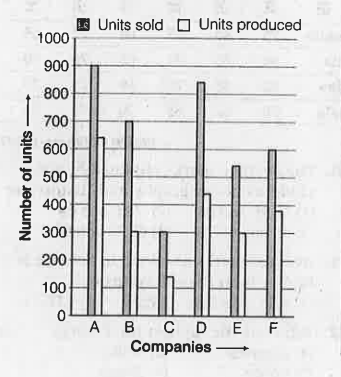
The total produced by the companies A B and C together is
View SolutionFind out the total sales (in thousand) of company C1, C3 and C5 together in two years?
View SolutionThe number of tickets of movie B sold in Hyderabad was approximately, what per cent of the total number of tickets of the same movie sold in all the cities together?
View Solution

