The bar chart represents percentage marks scored by four students U, V, W and X in History and Geography. Consider the bar chart and answer questions based on it.
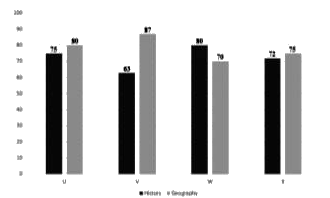
Who scored the highest percentage in both the subjects combined?
A. Both V and W
B. V
C. W
D. U
A
D
B
C
The correct Answer is:B
Step by step video, text & image solution for The bar chart represents percentage marks scored by four students U, V, W and X in History and Geography. Consider the bar chart and answer questions based on it. Who scored the highest percentage in both the subjects combined? A. Both V and W B. V C. W D. U by Maths experts to help you in doubts & scoring excellent marks in Class 14 exams.
Updated on:21/07/2023Similar Questions
The bar chart represents percentage marks scored by four students U, V, W and X in History and Geography. Consider the bar chart and answer questions based on it.
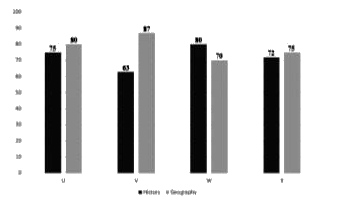
What is the percentage difference in the total marks obtained in Geography and History?
A. 7.58%
B. 7%
C. 4.13%
D. 5%
View SolutionThe following table represents the percentage marks of four students in six subjects. Consider the table and answer questions based on it.
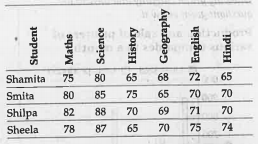
Who has the highest total marks
View Solution
Knowledge Check
The bar chart represents percentage marks scored by four students U, V, W and X in History and Geography. Consider the bar chart and answer questions based on it.
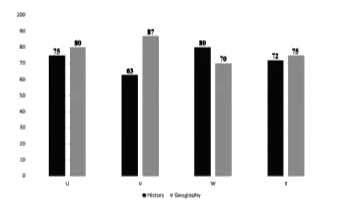
What is the average percentage marks obtained in History by all students?
A. 78%
B. 75%
C. 72.5%
D. 70%ACBBCADDComprehension:
The bar chart represents marks of four students S1, S2, S3 and S4 in Physics and Chemistry. Consider the bar chart and answer questions based on it.
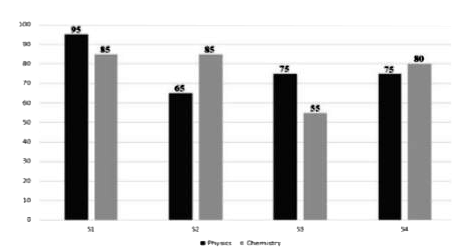
What is the ratio of total marks in both subjects obtained by S2 to that of S4?A25/31B30/31C36/31D31/25Comprehension:
The bar chart represents marks of four students S1, S2, S3 and S4 in Physics and Chemistry. Consider the bar chart and answer questions based on it.
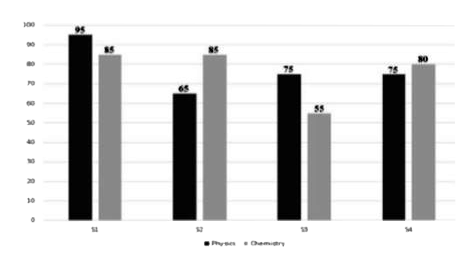
What is the ratio of marks obtained in Physics of S3 to that of S 1?A11/19B15/19C13/19D17/19
The following table represents the percentage marks of four students in six subjects. Consider the table and answer questions based on it.
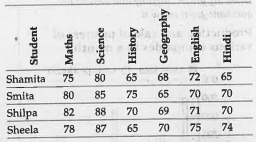
The average marks obtained by the students in Geography and History are
View SolutionComprehension:
The bar chart represents marks of four students S1, S2, S3 and S4 in Physics and Chemistry. Consider the bar chart and answer questions based on it.
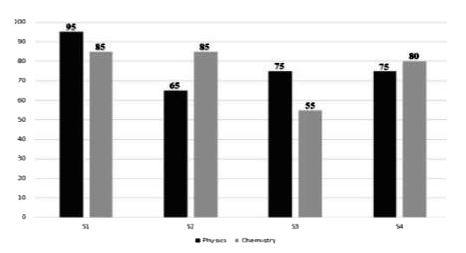
What is the ratio of total marks of all students in Chemistry to that of Physics in percentage?
View SolutionThe following table represents the percentage marks of four students in six subjects. Consider the table and answer question based on it.
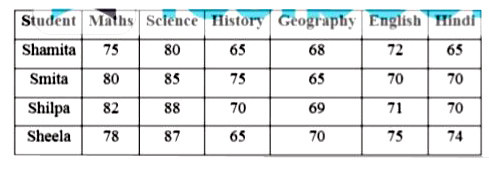
Who has the highest total marks ?
A. Shamita
B. Smita
C. Shilpa
D. Sheela
View SolutionThe following table represent the marks of four students in five subjects.
 Consider the information and answer questions based on it.
Who has the highest average marks?
A. Shyam
B. Sunil
C. Jagdish
D. Rajesh
View SolutionThe following table represents the percentage marks of four students in six subjects. Consider the table and answer question based on it.
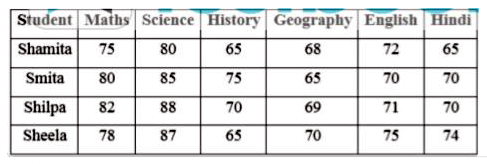
The average marks obtained by the students in Geography and History are
A. 68.75 and 68
B. 70.5 and 69
C. 68 and 68.75
D. 68.75 and 68.5
View Solution
