Study the following graph carefullv and answer the question that follows.
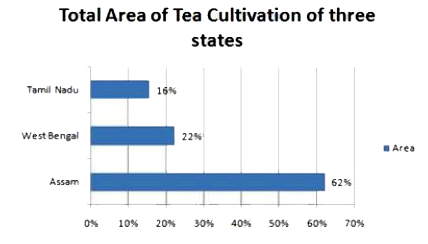
Area cultivated in West Bengal is what percentage more than that cultivated in Tamil Nadu?
a)0.06
b)0.08
c)0.04
d)0.03
The correct Answer is:A
Step by step video, text & image solution for Study the following graph carefullv and answer the question that follows. Area cultivated in West Bengal is what percentage more than that cultivated in Tamil Nadu? by Reasoning experts to help you in doubts & scoring excellent marks in Class 14 exams.
Updated on:21/07/2023Similar Questions
Study the following bar graph carefully to answer the questions.
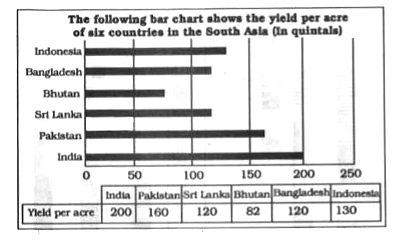
The yield per acre of India is what percent more than that of Pakistan?
View SolutionStudy the given graph and answer the question that follows
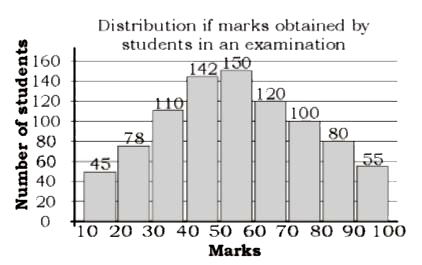
The total marks of students obtaining less than 50 marks is what percentage more than the total number of students obtaining 60 marks or more
View Solution
Knowledge Check
Study the following bar graph and answer the question that follows.
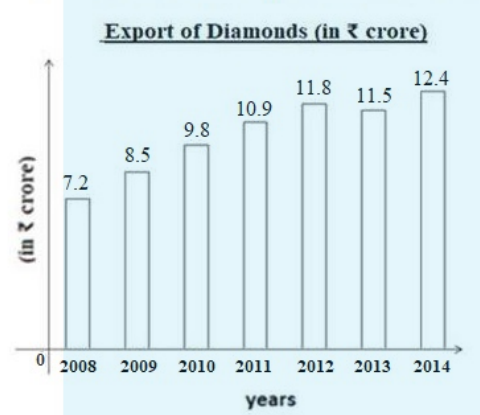
In which year was the maximin percentage increase in diamonds exports compared to the previous year?A2014B2009C2010D2012Study the following graph carefully and answer the questions that follow
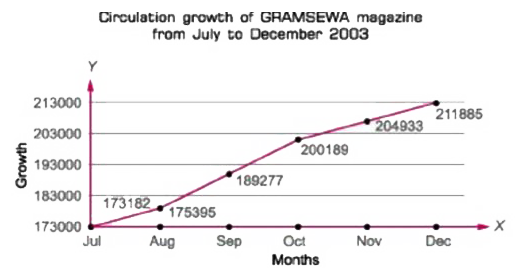
The circulation in October is ……. times than that of July .A1.5B1C1.15DNone of theseStudy the following graph carefully and answer the questions that follow
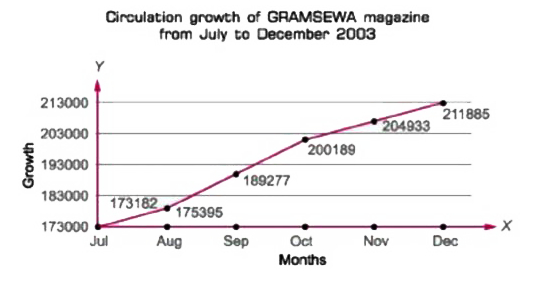
The circulation of magazine in November is …….. more than that of SeptemberA15566B16556C15656D16000
Study the following graph carefully and answer the questions that
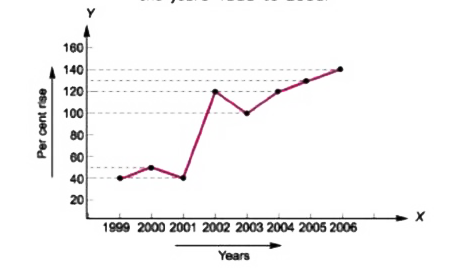
For how many years , the percent rise was more than 100 % ?
View SolutionStudy the following graph carefully and answer the questions that follow
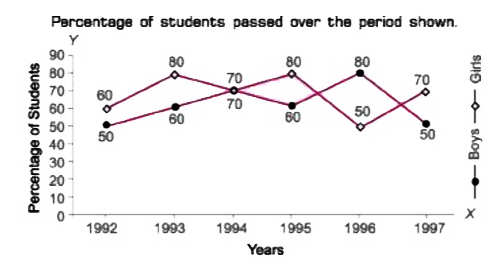
What is the over all percentage of failed boys over the period shown ?
View SolutionStudy the picture and answer the question that follows:
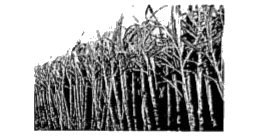
Which type of cultivation is that?
View SolutionStudy the following graph carefully and answer the questions that follow
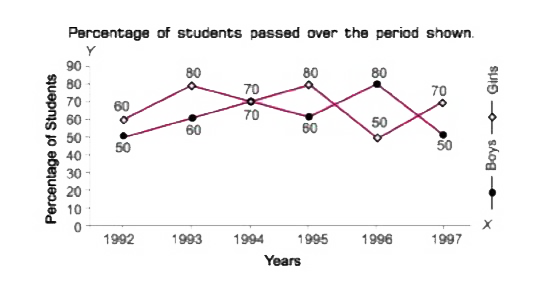
For how many times was the gap constant for the percentage of successful boys and girls ?
View SolutionStudy the following graph carefully and answer the questions that follow
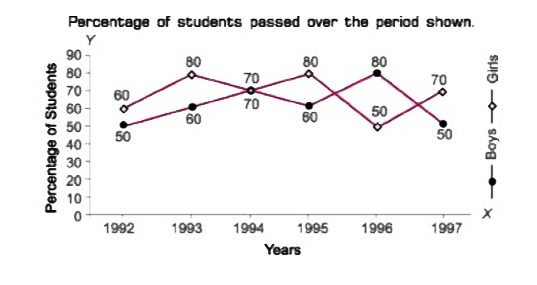
For how many years was there a paired rise or fall in the percentage of boys and girls passed over the period shown ?
View Solution
