The data below shows the number of students in class A and B having secured different marks.
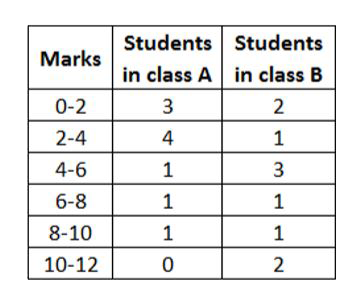
What is the combined mean of A and B?
3.75
3.5
4.7
4
The correct Answer is:C
Step by step video, text & image solution for The data below shows the number of students in class A and B having secured different marks. What is the combined mean of A and B? by Maths experts to help you in doubts & scoring excellent marks in Class 14 exams.
Updated on:21/07/2023Similar Questions
The distribution given below show the marks of 100 students of a class:
then find Ogive medium of data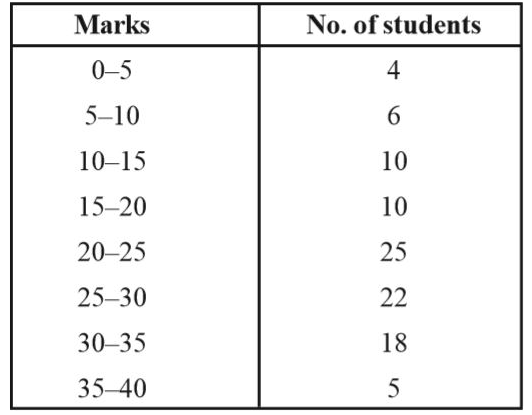
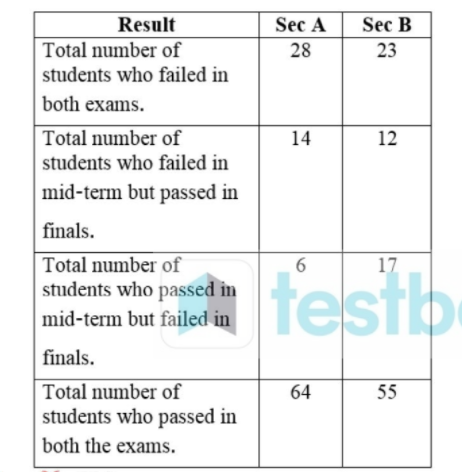
View SolutionThe below table gives the details of the number of students in Class 10, section A and B who had taken mid-term and final exam. What is the total number of students in both, section A and B?
View Solution
Knowledge Check
The data below shows the number of students in class A having secured different marks.
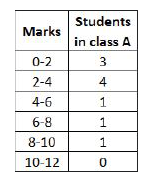
What is the mean marks of class A?A2B3.8C2.8D1.6The table given below shows the number of students enrolled in different courses of different colleges.
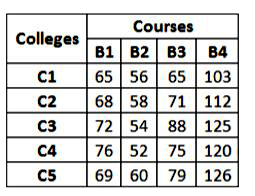
What is the average number of students per college enrolled in course B2?A60B56C58D53The pie chart given below shows the number of students in 5 sections .The number of students is 7200.
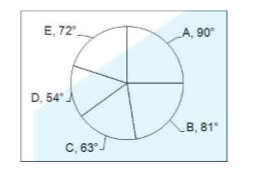
What is the total number of students in section E and section B?Aa)3060Bb)2900Cc)5300Dd)6000
The data given below shows the number of people who have saved a certain amount of money
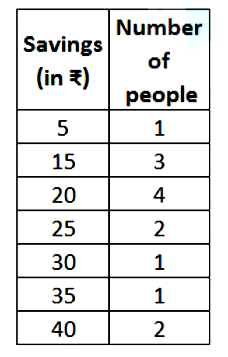
What is the mean saving per person?
View SolutionThe table shows the marks obtained by 25 students in a class test. Find the mean of the marks obtained

View SolutionThe given bar chart shows the number of students in a class who have secured marks in three ranges: >=75%,60%−74%and<60%.

What is the ratio of percentages of boys and girls who got marks from 60% to 74%?
View SolutionThe Table given below shows the number of students having obtained different marks. MarksNumber of Students9−11611−13513−15215−17217−195
What is the mean marks per student ?
View SolutionThe table given below shows the number of students who have taken admission in school A and B from the years 2010 to 2015.
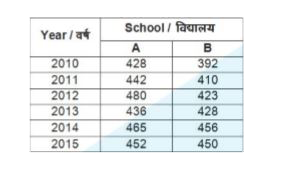
What is the average difference of number of students in school A and B in the given period?
View Solution