Study the following line graph and answer the question based on it.
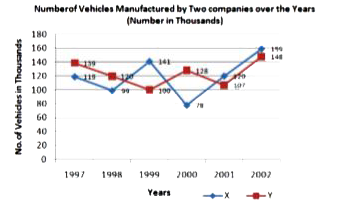
What is the difference between the total productions of the two companies from 1997 to 2000?
40000
50000
30000
60000
The correct Answer is:B
Step by step video, text & image solution for Study the following line graph and answer the question based on it. What is the difference between the total productions of the two companies from 1997 to 2000? by Maths experts to help you in doubts & scoring excellent marks in Class 14 exams.
Updated on:21/07/2023Similar Questions
Knowledge Check
Study the following line graph and answer the question based on it.
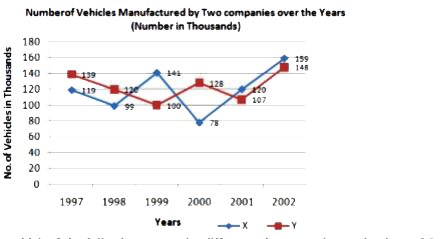
In which of the following years, the difference between the productions of Companies X and Y was the minimum among the given years?A1997B2000C2002D1999Study the following line graph and answer the questions.
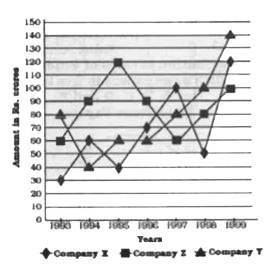
What was the difference between the average exports of all three companies in 1994 and 1995 ?ARs. 5 croresBRs. 20 croresCRs. 10 croresDRs. 30 croresStudy the following line graph and answer the questions.
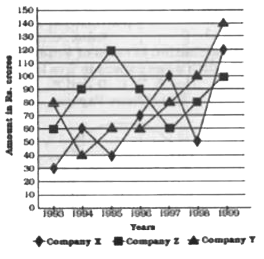
In which year was the difference between the exports of companies Y and Z maximum ?A1994B1997C1995D1996
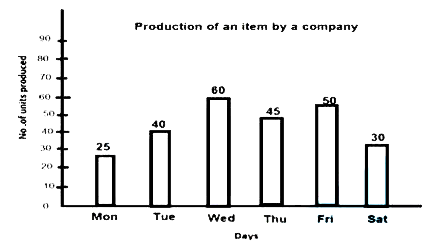
Study the following graph and answer the question based on the graph.
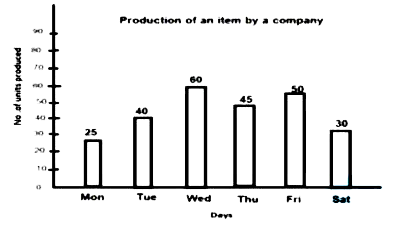
What was the percentage decline in the production from Friday to Saturday?
View SolutionStudy the following graph carefully and answer the questions -----
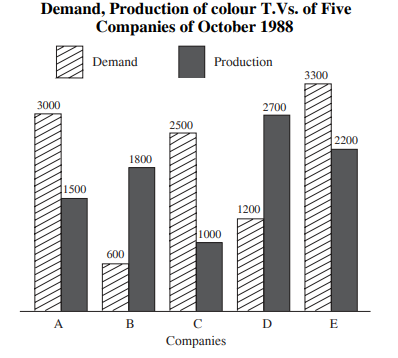
What is the difference between average demand and average production of the five companies taken together ?
View SolutionStudy the following graph carefully and answer the questions that follow
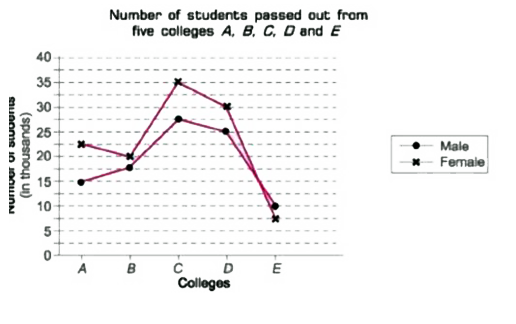
What is the difference between the total number of students passing out from collegee A and the total number o students passing out from college El.
View SolutionStudy the following table and the answer the questions based on it : (in lakhs of Rs.)
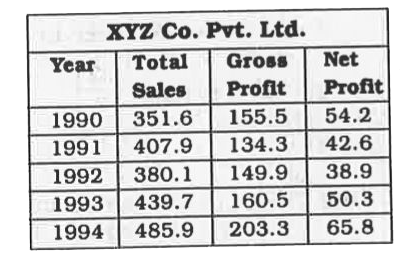
In which year the difference between the total sales and the gross profit is the least ?
View SolutionStudy the following graph carefully and answer the question given below-----
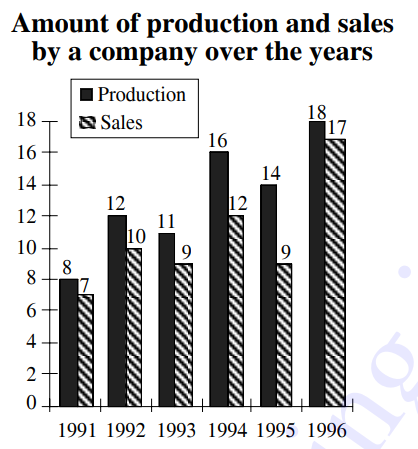
What was the difference between the sales of 1992 and 1995 ?
View Solution

