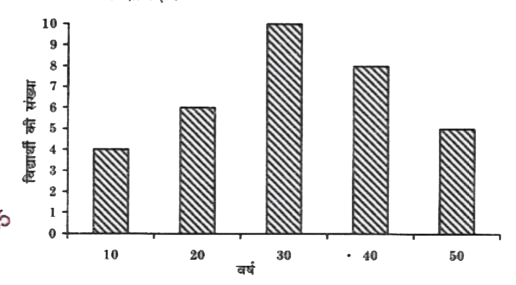
The ratio of the students obtaining marks in the first and the last interval is.
प्रथम और अंतिम अंतराल से अंक प्राप्त करने वाले विद्यार्थियों का अनुपात बताइए।
The correct Answer is:C
अभीष्ट अनुपात = 4 : 5
Similar Questions
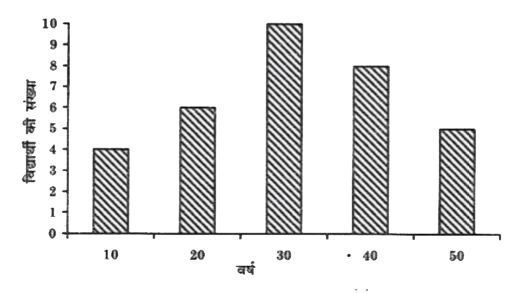
The least number of students got the marks in the interval.
किस अंतराल में अंक प्राप्त करने वाले विद्यार्थियों की न्यूनतम संख्या थी?
View SolutionThe given Bar Graph presents the number of students of two schools for six years.
दिया गया दंड आरेख (बार ग्राफ) छह वर्षो के दौरान दो स्कूलों में विद्यार्थियों की संख्या को दर्शाता है|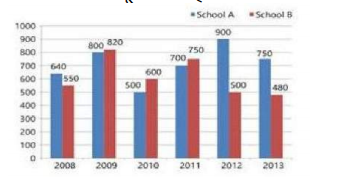
What is the ratio of the students taken for all years together from school B to that from school A?
सभी वर्षों के दौरान स्कूल B और स्कूल A के कुत्र विद्यार्थियों का अनुपात क्या है?
View Solution
Knowledge Check
Study the following Histogram and answer the following questions.
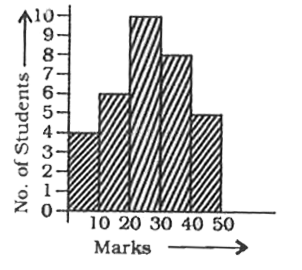
The ratio of the students obtaining marks in the first and the last interval isA5:4B6:5C4:5D3:4
The table given below shows the number of students having obtained different marks
नीचे दी गयी तालिका अलग-अलग अंक प्राप्त करने वाले छात्रों की संख्या को दर्शाती है |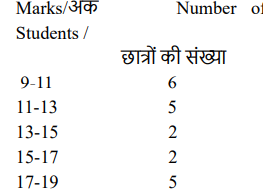
What is the mean marks per student ?
प्रति छात्र माध्य अंक कितना है ?
View SolutionStudy the given histogram that shows the marks obtained by students in an examination and answer the questions that follow
दिए गए हिस्टोग्राम का अध्ययन करें जो एक परीक्षा में छात्रों द्वारा प्राप्त किए गए अंकों को दिखाता है और आने वाले प्रश्नों का उत्तर ज्ञात करे|
The number of students who obtained less than 350 marks is what percent more than the number of students who obtained 400 or more marks?(correct to one decimal place )
350 से कम अंक प्राप्त करने वाले छात्रों की संख्या 400 या अधिक अंक प्राप्त करने वाले छात्रों की संख्या की तुलना में प्रतिशत अधिक है| (एक दशमलव स्थान तक )
View SolutionStudy the bar diagram and answer the questions.
बार-आरेख का अध्ययन करें और प्रश्नों का उत्तर दें। Ratio of highest and lowest
marks obtained in first term among all the subjects is
सभी विषयों में, पहली बार में प्राप्त उच्चतम और निम्नतम अंकों का अनुपात है-
View SolutionThe given graph shows the marks obtained by students in an examination.
दिया गया आरेख किसी परीक्षा में छात्रों के प्राप्तांक दर्शाता है | The number of students who obtained less than 300 marks is what percent more than the number of students who obtained 350 or more marks?
300 अंक से कम प्राप्त करने वाले छात्रों की संख्या 350 या इससे अधिक अंक प्राप्त करने वाले छात्रों की संख्या से कितना प्रतिशत अधिक है ?
View SolutionStudy the given histogram that shows the marks obtained by students in an examination and answer the question that follows:
दिए गए हिस्टोग्राम का अध्ययन करें जो एक परीक्षा में छात्रों द्वारा प्राप्त किए गए अंकों को दिखाता है और निम्न प्रश्न का उत्तर दे|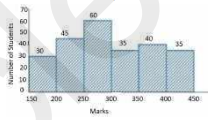 The number of students who obtained less than 250 marks is what percent more than the number of student who obtained 400 or more marks ?(correct to one decimal place)
250 से कम अंक प्राप्त करने वाले छात्रों की संख्या 490 या अधिक अंक प्राप्त करने वाले छात्र की संख्या से कितने प्रतिशत अधिक है? (एक दशमलव तक)
View SolutionFind the number of students who took an exam if the ratio of those who passed to those who failed in the exam was 10:3. If 40 more students had taken the exam and 10 less has failed, then the ratio of those who passed to those who failed in the exam would have been 5:1.
परीक्षा देने वाले विद्यार्थियों की संख्या ज्ञात करें यदि उस परीक्षा में उत्तीर्ण होने वाले और अनुत्तीर्ण रहने वाले विद्यार्थियों का अनुपात 10:3 था। यदि 40 अन्य विद्यार्थियों ने परीक्षा दी होती और 10 कम छात्र अनुत्तीर्ण हुए होते, तो उस परीक्षा में उत्तीर्ण हुए और अनुत्तीर्ण रहने वाले विद्यार्थियों का अनुपात 5:1 होता।
View SolutionThe average marks of two classes M and N are 25 and 40 respectively and the overall average is 30. The ratio of the students of classes M and N is :
दो कक्षाओं M तथा N के औसत अंक क्रमश: 25 तथा 40 है, और प्राप्त समग्र औसत 30 है | कक्षा M और N के छात्रों का अनुपात है :
View Solution
