In the following questions, study the two pie-charts and answer the questions.
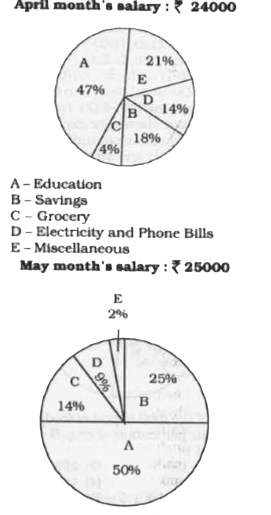
The average amount spent on Education, Grocery and Savings from April month's salary is:
Rs 6000
Rs 6325
Rs 5520
Rs 5800
The correct Answer is:C
औसत राशि =(47+4+18)×24000100×3=69×240003×100=23×240=5520
Similar Questions
Study the pie-chart and answer the questions.
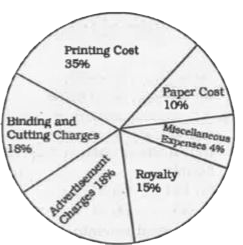
The central angle for the sector on "Paper-Cost" is
View SolutionIn the following questions, study the two pie-chart and answer the questions.
A - Education, B - Savings, C - Grocery D - Electricity and Phone Bills, E - Miscellaneous
A - शिक्षा, B- बचत, C- किराना,
D- बिजली तथा फोन बिल, E- विविध
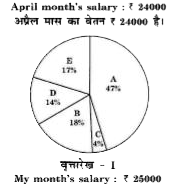
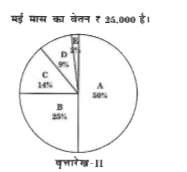
The ratio of amount spent for savings in April month's salary and miscellaneous in May month's salary is :
अप्रैल महीने के वेतन से बचत की राशि और मई महीने के वेतन से विविध खर्च की राशि का अनुपात कितना है?
View Solution
Knowledge Check
In the following questions, study the two pie-charts and answer the questions.
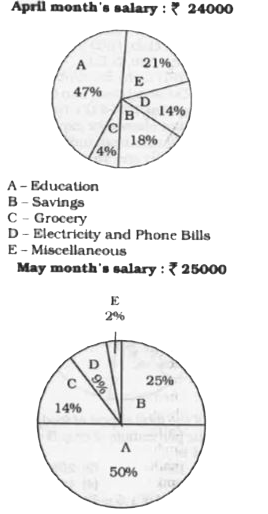
From the salary of May, the amount spent on Grocery and Electricity are:ARs 6250, Rs 3360BRs 960, Rs 5040CRs 3500, Rs 2250DRs 2160, Rs 480In the following questions, study the two pie-charts and answer the questions.
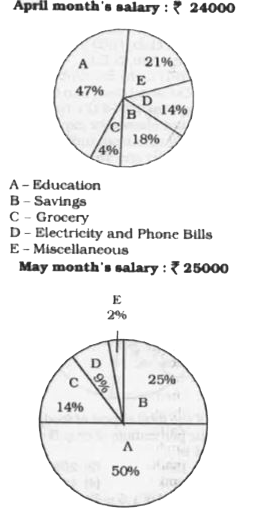
The ratio of amount spent for savings in April month's salary and miscellaneous in May month's salary is :A216:25B217:26C205:13D235:50In the following questions, study the two pie-charts and answer the questions.
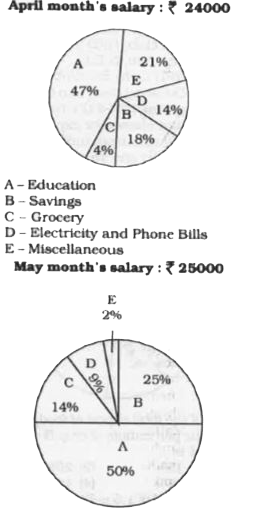
What is the percent increase in Education in May month than April month ?A9.56%B12.35%C20%D10.82%
In the following questions, study the two pie-chart and answer the questions.
A - Education, B - Savings, C - Grocery D - Electricity and Phone Bills, E - Miscellaneous
A - शिक्षा, B- बचत, C- किराना,
D- बिजली तथा फोन बिल, E- विविध


From the salary of May, the amount spent on Grocery and Electricity are :
मई के वेतन से किराना तथा बिजली पर कितनी राशि खर्च की गई?
View SolutionIn the following questions, study the two pie-chart and answer the questions.
A - Education, B - Savings, C - Grocery D - Electricity and Phone Bills, E - Miscellaneous
A - शिक्षा, B- बचत, C- किराना,
D- बिजली तथा फोन बिल, E- विविध


What is the percent increase in Education in May month than April months?
अप्रैल महीने की तुलना में मई महीने में शिक्षा के खर्च में कितने प्रतिशत की वृद्धि हुई है?
View SolutionThe pie chart given below shows the expenditure on various items and savings of a family during the year 2009. Study the pie chart and answer these questions.
 The percentage of the income which was spent on clothing, education of children and transport together is-
View SolutionStudy the following pie-chart and answer the questions.
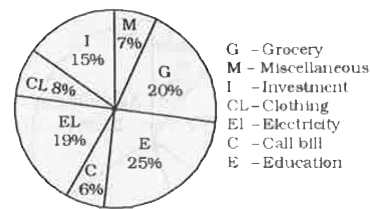
The budget estimated by the family on clothing and grocery together is :
View SolutionStudy the following pie-chart and answer the questions.
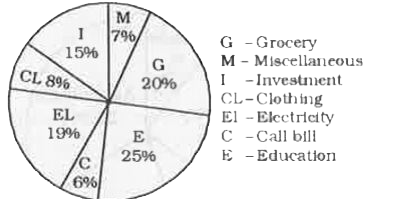
The difference in the amount estimated by the family on electricity and call bill is :
View Solution
