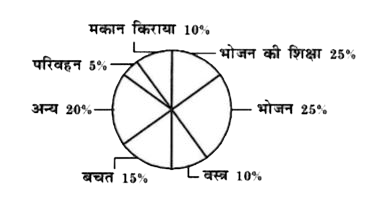
The following pie-chart shows the monthly expenditure of a family on food, clothing, rent, miscellaneous expenses and savings. What is the central angle for savings?
54
72
56
45
The correct Answer is:A
∵15%=₹3000
∴100%=₹20000
सबसे अधिक भोजन पर खर्च हुआ है 25%
=25×20000100=₹5000
Similar Questions
The following pie-chart shows the monthly expenditure of a family on food, house rent clothing, education, fuel and miscellaneous Study the pie-chart
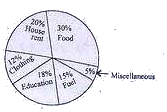
The central angle of the sector for the expenditure on fuel (in degrees) isView SolutionThe following pie-chart shows the monthly expenditure of a family on food, house rent clothing, education, fuel and miscellaneous Study the pie-chart
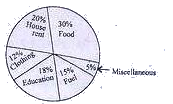
If the percentage of expenditure on food is x % of the total percentage of expenditure on clothing, education and fuel, then x equalsView Solution
Knowledge Check
- Question 1 - Select One
Following bar diagram shows the monthly expenditure of two families on food, clothing, education, fuel, house rent and miscellaneous (in percentage).
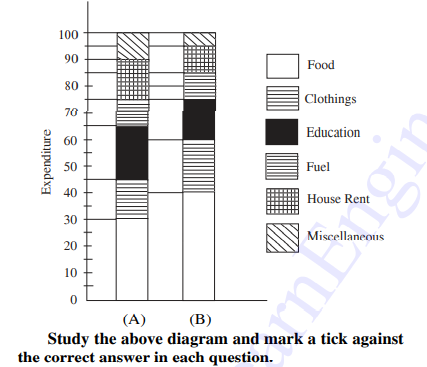
What percentage is B's expenditure on food over A's expenditure on food ? ( Taking equal total expenditure)A10%B70%C13313%D75% - Question 2 - Select One
Following bar diagram shows the monthly expenditure of two families on food, clothing, education, fuel, house rent and miscellaneous (in percentage).
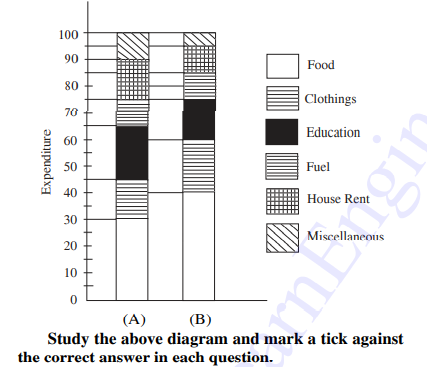
What fraction of the total expenditure is spent on Education in Family A ?A(13)/(20)B2/3C9 / (13)DNone of these - Question 3 - Select One
The following pie-chart shows the monthly expenditure of a family on various items. If the family spends Rs. 825 on clothing, answer the question
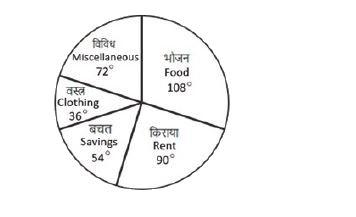
What is the average of expenses on clothing and rent?ARs. 1443.75BRs. 1344.57CRs. 1574.34DRs. 1734.45
The following pie-chart shows the monthly expenditure of a family on food, house rent clothing, education, fuel and miscellaneous Study the pie-chart
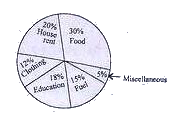
Total percentage of expenditure on house rent, clothing and fuel is greater than the percentage of expenditure on food byView SolutionThe following pie-chart shows the monthly expenditure of a family on food, house rent clothing, education, fuel and miscellaneous Study the pie-chart
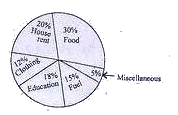
If the expenditure on fuel is Rs 3000, then the total expenditure excluding expenditure on house rent and education isView SolutionThe following pie-chart shows the monthly expenditure of a family on food, house rent clothing, education, fuel and miscellaneous Study the pie-chart
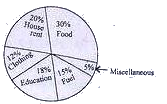
If the expenditure for food is 9000, then the expenditure for education isView SolutionIn the given pie chart what is the total expenditure on rent
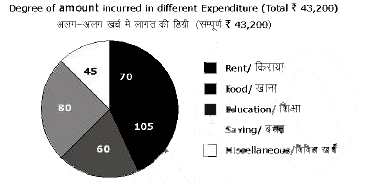 View Solution
Following bar diagram shows the monthly expenditure of two families on food, clothing, education, fuel, house rent and miscellaneous (in percentage).
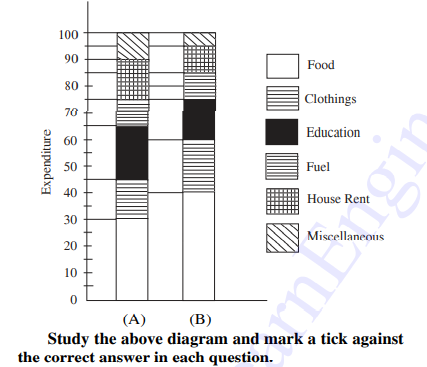
If the total annual expenditure of family A is Rs. 30,000 then money spent on food, clothes and house rent is -----View Solution
