Four diagrams are given for each question. Choose the best diagram that describes Lemons, Citrus Fruits, Chocolates .
चार आरेख नीचे दिये हुए हैं तो बताइए नींबू, खट्टे फल, चॉकलेट को कौन-सा आरेख दर्शाता है?


The correct Answer is:C
Step by step video, text & image solution for Four diagrams are given for each question. Choose the best diagram that describes Lemons, Citrus Fruits, Chocolates . चार आरेख नीचे दिये हुए हैं तो बताइए नींबू, खट्टे फल, चॉकलेट को कौन-सा आरेख दर्शाता है? by Reasoning experts to help you in doubts & scoring excellent marks in Class 14 exams.
Updated on:21/07/2023Similar Questions
Choose the venn diagram from the given options that best represents the relationship amongst the following classes:
उस वेन आरेख का चयन करें जो निम्नलिखित वर्गों के बीच संबंध को सर्वश्रेष्ठ तरीके से दर्शाता है | Student, Player, Spectator विद्यार्थी, खिलाड़ी, दर्शक
View SolutionChoose the venn diagram from the given options that best represents the relationship amongst the following classes:
उस वेन आरेख का चयन करें जो निम्नलिखित वर्गों के बीच संबंध को सर्वश्रेष्ठ तरीके से दर्शाता है | Year, month, day वर्ष, माह, दिन
View Solution
Knowledge Check
Identify the diagram that best represents the relationship among classes given below Minutes, Days, Months
वह आरेख चुनिए जो नीचे दिए गए वर्गों के बीच सम्बंध को सही दर्शाता है।
मिनट, दिन, महीनाA B
B C
C D
D
Choose the venn diagram from the given options that best represents the relationship amongst the following classes:
उस वेन आरेख का चयन करें जो निम्नलिखित वर्गों के बीच संबंध को सर्वश्रेष्ठ तरीके से दर्शाता है | Teacher, Singer, Mothers शिक्षक, गायक, माताएं
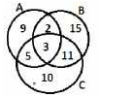
View SolutionIn the given Venn diagram, A denotes mangoes, B denotes bananas, C denotes apples, and the numbers in each section represent the number of persons who like fruits. How many persons like only bananas? /
दिए गए वेंन आरेख में, A आम को, B केले को, C सेब को दर्शाता है | प्रत्येक अंक उस अनुभाग के फलों को पसंद करने वाले लोगों ही दर्शाता है | कितने लोगों को केवल केले पसंद है?
View SolutionIn the given Venn diagram, the hexagon represents 'farmers', the circle represents 'beneficiaries' and the square represents 'land-owners'. The numbers given in the diagram represent the number of persons in that particular category.
दिए गये वेन आरेख में, षट्भुज “किसानों' को दर्शाता है, वृत्त “लाभार्थियों' को दर्शाता है तथा वर्ग 'भू-स्वामियों' को दर्शाता है | आरेख में दी गयी संख्याएँ उस विशेष श्रेणी में लोगों की संख्या के बारे में बताती हैं | How many farmers are both land-owners and beneficiaries?
कितने किसान ऐसे हैं जो भू-स्वामी और लाभार्थी दोनों हैं ?
View SolutionIn the given Venn diagram, the pentagon represents ‘cricketers’, the square represents ‘Chess players’ and the circle represents ‘Clerks’. The numbers given in the diagram represent the number of persons in that particular category.
दिए गए वेन आरेख में, पंचभुज “क्रिकेटरों' को दर्शाता है, वर्ग “शतरंज खिलाड़ियों” को दर्शाता है तथा वृत्त 'लिपिकों? का प्रतिनिधित्व करता है | आरेख में दी गयी संख्याएँ उस विशेष श्रेणी में लोगों की संख्या के बरे में बताती हैं | How many cricketers are chess players but NOT clerks?
कितने क्रिकेटर शतरंज खिलाड़ी तो हैं लेकिन लिपिक नहीं ?
View SolutionSelect the venn diagram that best represents the relationship between the following classes. Cows, Wild animals, Fox
उस वेन आरेख का चयन करें जो नीचे दिए गए वर्गों के बीच संबंध को दर्शाता है | गाय, जंगली पशु, लोमड़ी
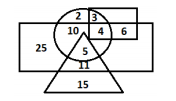
View SolutionThe given Venn diagram represents employees in an organisation The triangle represents executives, the circle represents females, the rectangle represents MBAs and the square represents technical staff. The numbers given in the diagram represent the number of persons in that particular category.
दिया गए वेन आरेख किसी संगठन में कर्मचारियों को दर्शाता है | त्रिभुज कार्यकारियों को दर्शाता है, वृत्त महिलाओं के बारे में बताता है, आयत MBA करने वाले लोगों को दर्शाता है तथा वर्ग तकनीकी कर्मचारियों के बारे में बताता है | आरेख में दी गयी संख्याएँ उस विशेष श्रेणी में लोगों की संख्या को दर्शाती हैं | How many female executives are there in the organisation
इस संगठन में कितने कार्यकारी हैं ?
View SolutionIn the given Venn diagram ‘Group A’ represents those who can speak ‘English’, ‘Group B’ represents those who can speak ‘Hindi’, and ‘Group C’ represents those who can speak ‘Marathi’. The numbers given in the diagram represent the number of persons in that particular category. /
दिए गए वेन आरेख में, 'समूह A उन्हें दर्शाता है जो “अंग्रेजी' बोल सकते हैं | समूह B उन्हें दर्शाता है जो (हिंदी! बोल सकते हैं तथा समूह C उन्हें दर्शाता है जो 'मराठी' बोल सकते हैं | आरेख में दी गयी संख्याएँ उस विशेष श्रेणी में लोगों की संख्या को दर्शाती हैं| How many persons can speak exactly two languages?
कितने व्यक्ति केवल दो भाषाएँ बोल सकते हैं?
View Solution

