Given bar graph shows, total expenditure and the gross receipts of a company (in Rs crores). Study the graph and answer the question that follows.
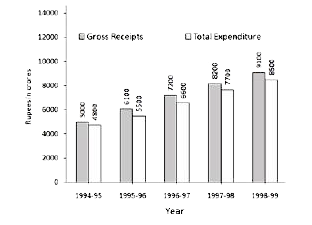
The total expenditure of the company in 1998-99 exceeds that in 1994-95 by (in Rs crore):
3800
3700
4800
5500
The correct Answer is:B
Step by step video, text & image solution for Given bar graph shows, total expenditure and the gross receipts of a company (in Rs crores). Study the graph and answer the question that follows. The total expenditure of the company in 1998-99 exceeds that in 1994-95 by (in Rs crore): by Maths experts to help you in doubts & scoring excellent marks in Class 14 exams.
Updated on:21/07/2023Similar Questions
In the given bar graph , the white bar shows the income and the black bar shows the expenditure of company (in Rs. Lakhs) . Study the graph and answer the question that follows .
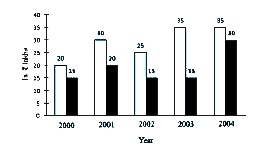
The percentage decrease in the income of the company in 2002 as compared to that in 2001 is :
View SolutionThe give graph represents the percentage distibution of the total expenditure of a company. Study the graph and answer the question that follows .
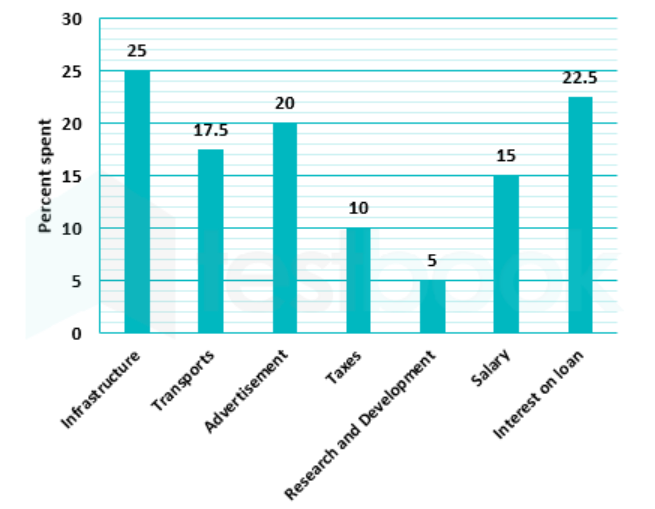
The total expenditure of the company is how many times the total expenditure on 'Research and Development' and 'Salary'?
View Solution
Knowledge Check
Given bar graph shows, total expenditure and the gross receipts of a company (in Rs crores). Study the graph and answer the question that follows
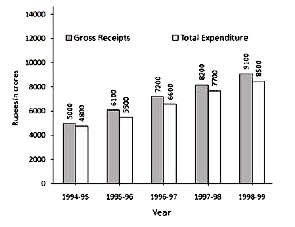
If profit = gross receipts - total expenditure, then In 1997-98, what percentage of gross receipts is the profit made? (Correct to one decimal place)A6.1%B5.4%C4.8%D3.9%Given bar graph shows, total expenditure and the gross receipts of a company (in Rs crores). Study the graph and answer the question that follows.
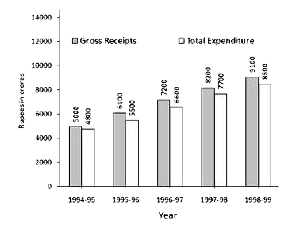
What is the percentage Increase in the gross receipts in 1996-97 as compared to 1994-95?A0.43B0.41C0.42D0.44Given bar graph shows, total expenditure and the gross receipts of a company (in ? crores). Study the graph and answer the question that follows.
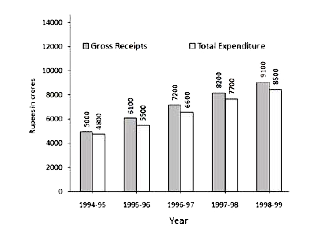
In order to make a profit of 20%. what should have been the gross receipts (in crore ?} in 1995-96. if the total expenditure remained the same?A6445B5776C6875D7565
In the given bar graph, the white bar shows the income and black bar shows the expenditure of a company . Study the graph and answer the question that follows .
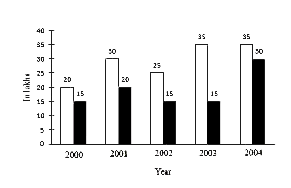
The expenditure from 2001 to 2002 decreased by
View SolutionThe bar diagram shows the monthly expenditure of a company. Study the graph and answer the questions.
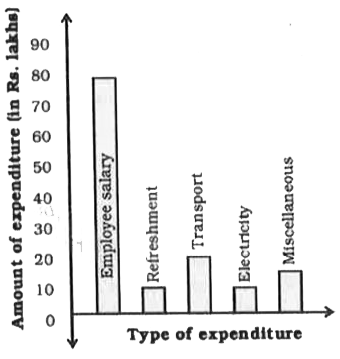
The total monthly expenditure of the company is :
View SolutionThe bar diagram shows the monthly expenditure of a company. Study the graph and answer the questions.
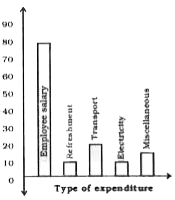
The total monthly expenditure of the company is :
View SolutionThe bar diagram shows the monthly expenditure of a company. Study the graph and answer the questions.
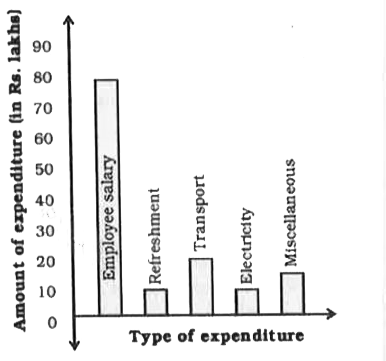
The fraction of money spent on refreshment is:
View SolutionThe bar diagram shows the monthly expenditure of a company. Study the graph and answer the questions.
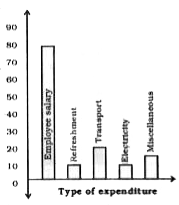
The fraction of money spent on refreshment is :
View Solution
