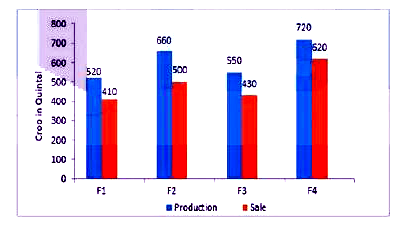
The given bar graph represents the production and sales of a certain crop in quintals by the farmers F1,F2,F3 and F4.
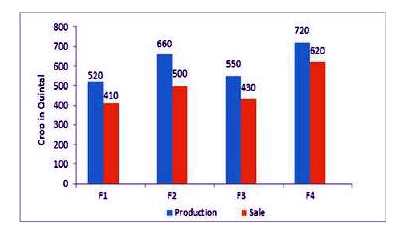
What is the ratio between the total sales and total prdouction by all farmers ?
3:4
5:6
4:5
6:7
The correct Answer is:C
Step by step video, text & image solution for The given bar graph represents the production and sales of a certain crop in quintals by the farmers F1,F2,F3 and F4. What is the ratio between the total sales and total prdouction by all farmers ? by Maths experts to help you in doubts & scoring excellent marks in Class 14 exams.
Updated on:21/07/2023Similar Questions
Knowledge Check
The given bar graph respresents the production and sale of a certain crop in quintals by the farmers F1, F2, F3 and F4.
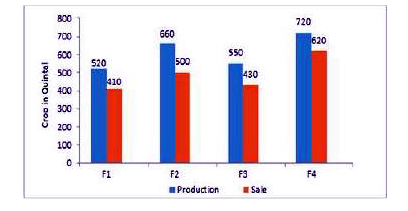
What is the average of a crop in quintals , sold by the all farmers ?A490B470C530D510The given bar graph represents the production and sales of certain crop in quintals by the farmers F1,F2,F3 and F4.
Whatis the percentage less in the production by farmer F1 with respect to the production by farmer F2 ?A23733%B21733%C24733%D22733%The given bar graph represents the producution and sales of a certain crop in quintals by the farmers F1, F2 , F3 and F4 .
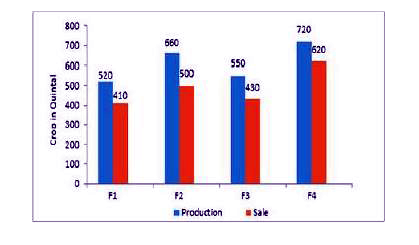
Which farmers recorded the highest percentage of sales with respect to the production ?AF4BF2CF3DF1
The given bar graph represents the sale of cars in five different states in a month.
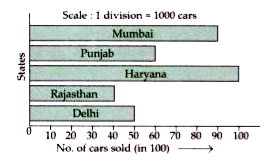 What is the difference between the numbre of cars sold in Mumbai and Punjab ?
View SolutionIn the given bar graph, what is the ratio of the total boys and girls in all 5 colleges.
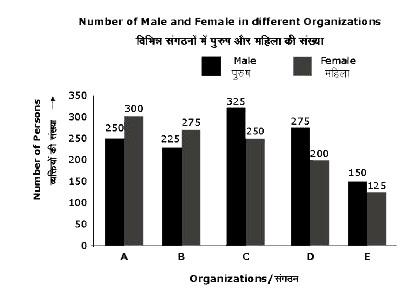
View SolutionIn the given bar graph, what is the ratio of the total males and females working in all organisation.
View SolutionThe following bar staph shows the sales (in thousands) of motor bikes bv the factories, F1, F2, F3 and F4 in 2017, 2018 and 2019.
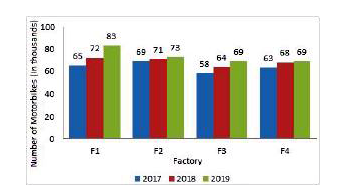
What is the ratio of total sales of Fl to that of F4 across all years?
View SolutionThe Bar Graph shows the production and sales of Mobile handsets of various campanies A,B,C,D,E & F in a month.
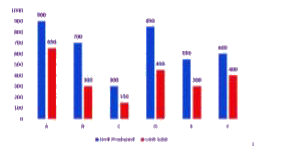
Which Company had the highest percentage of sale with respect to its production?
View Solution

